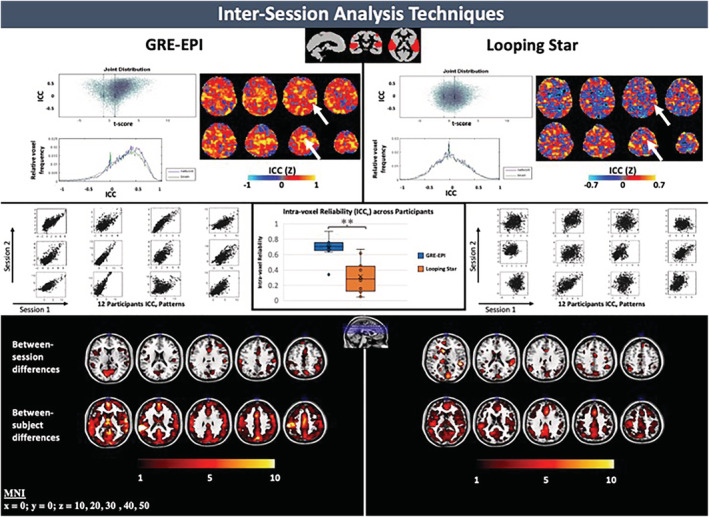
FIGURE 4.

(top) Plots of intra‐class correlation coefficient (ICC) versus T‐score, relative voxel frequency versus ICC and ICC z‐score map for each modality. Arrows indicate regions with consistently high z‐scores between modalities. (centre) Intra‐voxel reliability (ICCv) plots for each participant in an auditory region‐of‐interest (ROI) (top, centre) can be seen with accompanying box‐and‐whisker plot of the outputted ICCv valuesacross participants. Significant differences between intermodality intra‐voxel reliability was identified, where p(two‐tailed) = .002 (**p < .05). (bottom) Between‐session and between‐subject difference maps outputted from ICC analysis. Overlaid on ch2 image (Holmes et al., 1998) in MRICRON (Rorden & Brett, 2000). Slice (mm = millimetres) in MNI space provided. Scale of ICC z‐score maps adjusted to account for functional sensitivity differences between modalities
