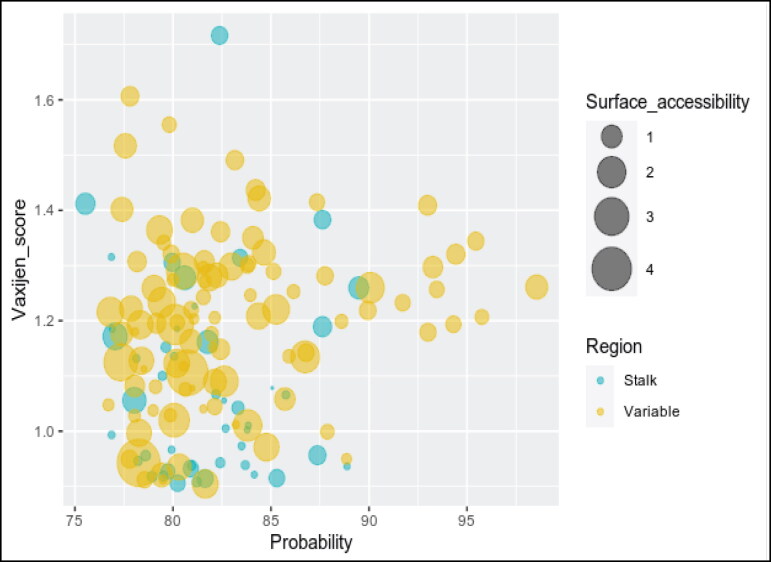
Figure 3.
Bubble plot analysis of the SARS-CoV-2 spike protein. The plot shows the probable B cell epitopes from the variable (S1 domain: aa13 to aa685) and stalk region (S2 domain: aa686 to aa1273) of the Spike protein. The corresponding Vaxijen score and the percentage of candidate vaccine probability shown in y and x axis, respectively. The size of each bubble signifies the respective surface accessibility. The B cell epitopes from the stalk S2 domain have less surface accessibility making it a poor vaccine candidate compared to the highly accessible B cell epitopes in the variable S1 domain and RBD.

