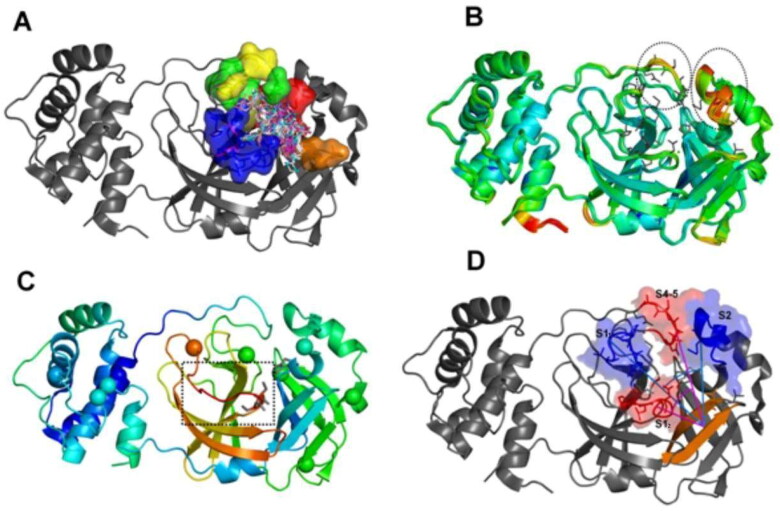
Figure 2.
The setting of the metadynamics collective variables based on intrinsic mobility of the pharmacophore subsites. (A) Superposition of crystallographic poses of different MPro ligands (depicted as sticks) at the enzyme active site. The five major MPro pharmacophoric subsites are depicted on surface representations and with different colors (blue for the S1 subsite; red for S2; green for S4; yellow for S5 and orange for the S11); (B) Superposition of 52 PDB structures of the SARS–CoV-2 (MCoV2pro) colored by the B-factors (blue:green:red scale, where red represents higher values) and highlighting the local hot spots at the subsites S2, S4 and S5 (dashed circles). Pharmacophore side chains are depicted in sticks; (C) Structure of the SARS-CoV1 Mpro (PDB: ID 2BX4) colored by the same B-factor scale and highlighting the significant local hot spots at the subsite S1 (dashed square). The Cα atoms of the twelve positions substituted between SARS-CoV1 and 2 are depicted as vdw spheres; (D) Angular collective variables used at our MetaDy experiments: CVang1 (cyan) between respective geometric centers at one half of S1 (S1’ in blue), the S1 prime bound β-hairpin (orange) and S2 (blue); CVang2 (magenta) between geometric centers at the other half of S1 (S1’ in red), the same β-hairpin (orange) and the S4-5 region (red).

