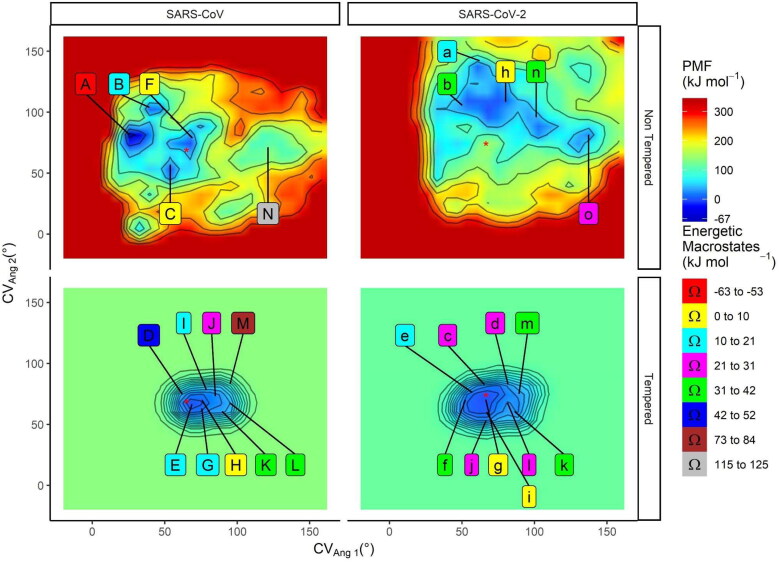
Figure 3.
Free energy landscape and representative cluster centroids from the SARS-CoV and SARS-CoV-2 Mpro MetaDy. Potential of mean force (PMF) maps for the SARS-CoV and SARS-CoV-2 Mpro for nontempered (above) and tempered (below) MetaDy. The zeropoint of the energetic scale is arbitrarily chosen, setting a 0 kJ · mol−1 value at the local minimum closer to the crystallographic structure (structure coordinates depicted as a red star). Capital and lowercase letters are used to point the location of each representative conformers sampled for MCoV1pro and MCoV2pro, respectively. The energetic window from each macrostate is described on a ‘valueL ≤ window range < valueR’ scheme, being valueL the left term and valueR the right one.

