Fig. 3.
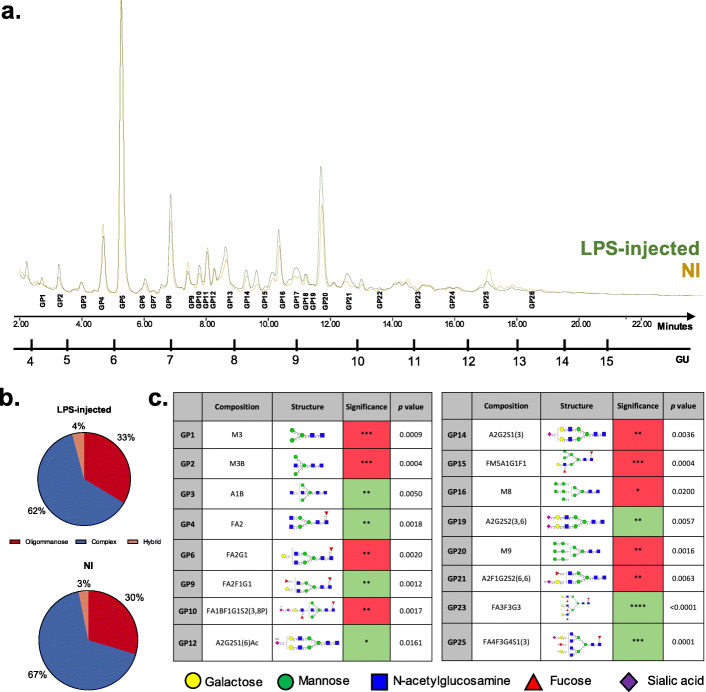
N-glycome changes between LPS-injected and NI striata using HILIC-UPLC. a HILIC-UPLC chromatograms for N-glycans isolated from rat striata (LPS-injected vs NI) during a 30-min run, separated into 26 main chromatographic glycan peaks (GP) following the characterisation performed by Samal et al. [41]. Detailed composition of each of these peaks is described in Supplementary table S1. b Relative abundances represented as percentages of total N-glycans divided into the three main biosynthetic classes: oligomannose, complex and hybrid. c Summary table of the GP that are statistically significantly different between LPS-injected and NI striatum at seven dpi. Red indicates significantly increased peak area (abundance) in the LPS-injected striatum, whereas green represents significantly decreased peak area in the LPS-injected striatum, compared to NI striatum. The abundance of these was Log transformed for statistical analysis. n = 5; paired Student’s t test was used to compare groups in each GP. All other GPs (not mentioned) did not show any significant difference in abundance between LPS-injected and NI striata

