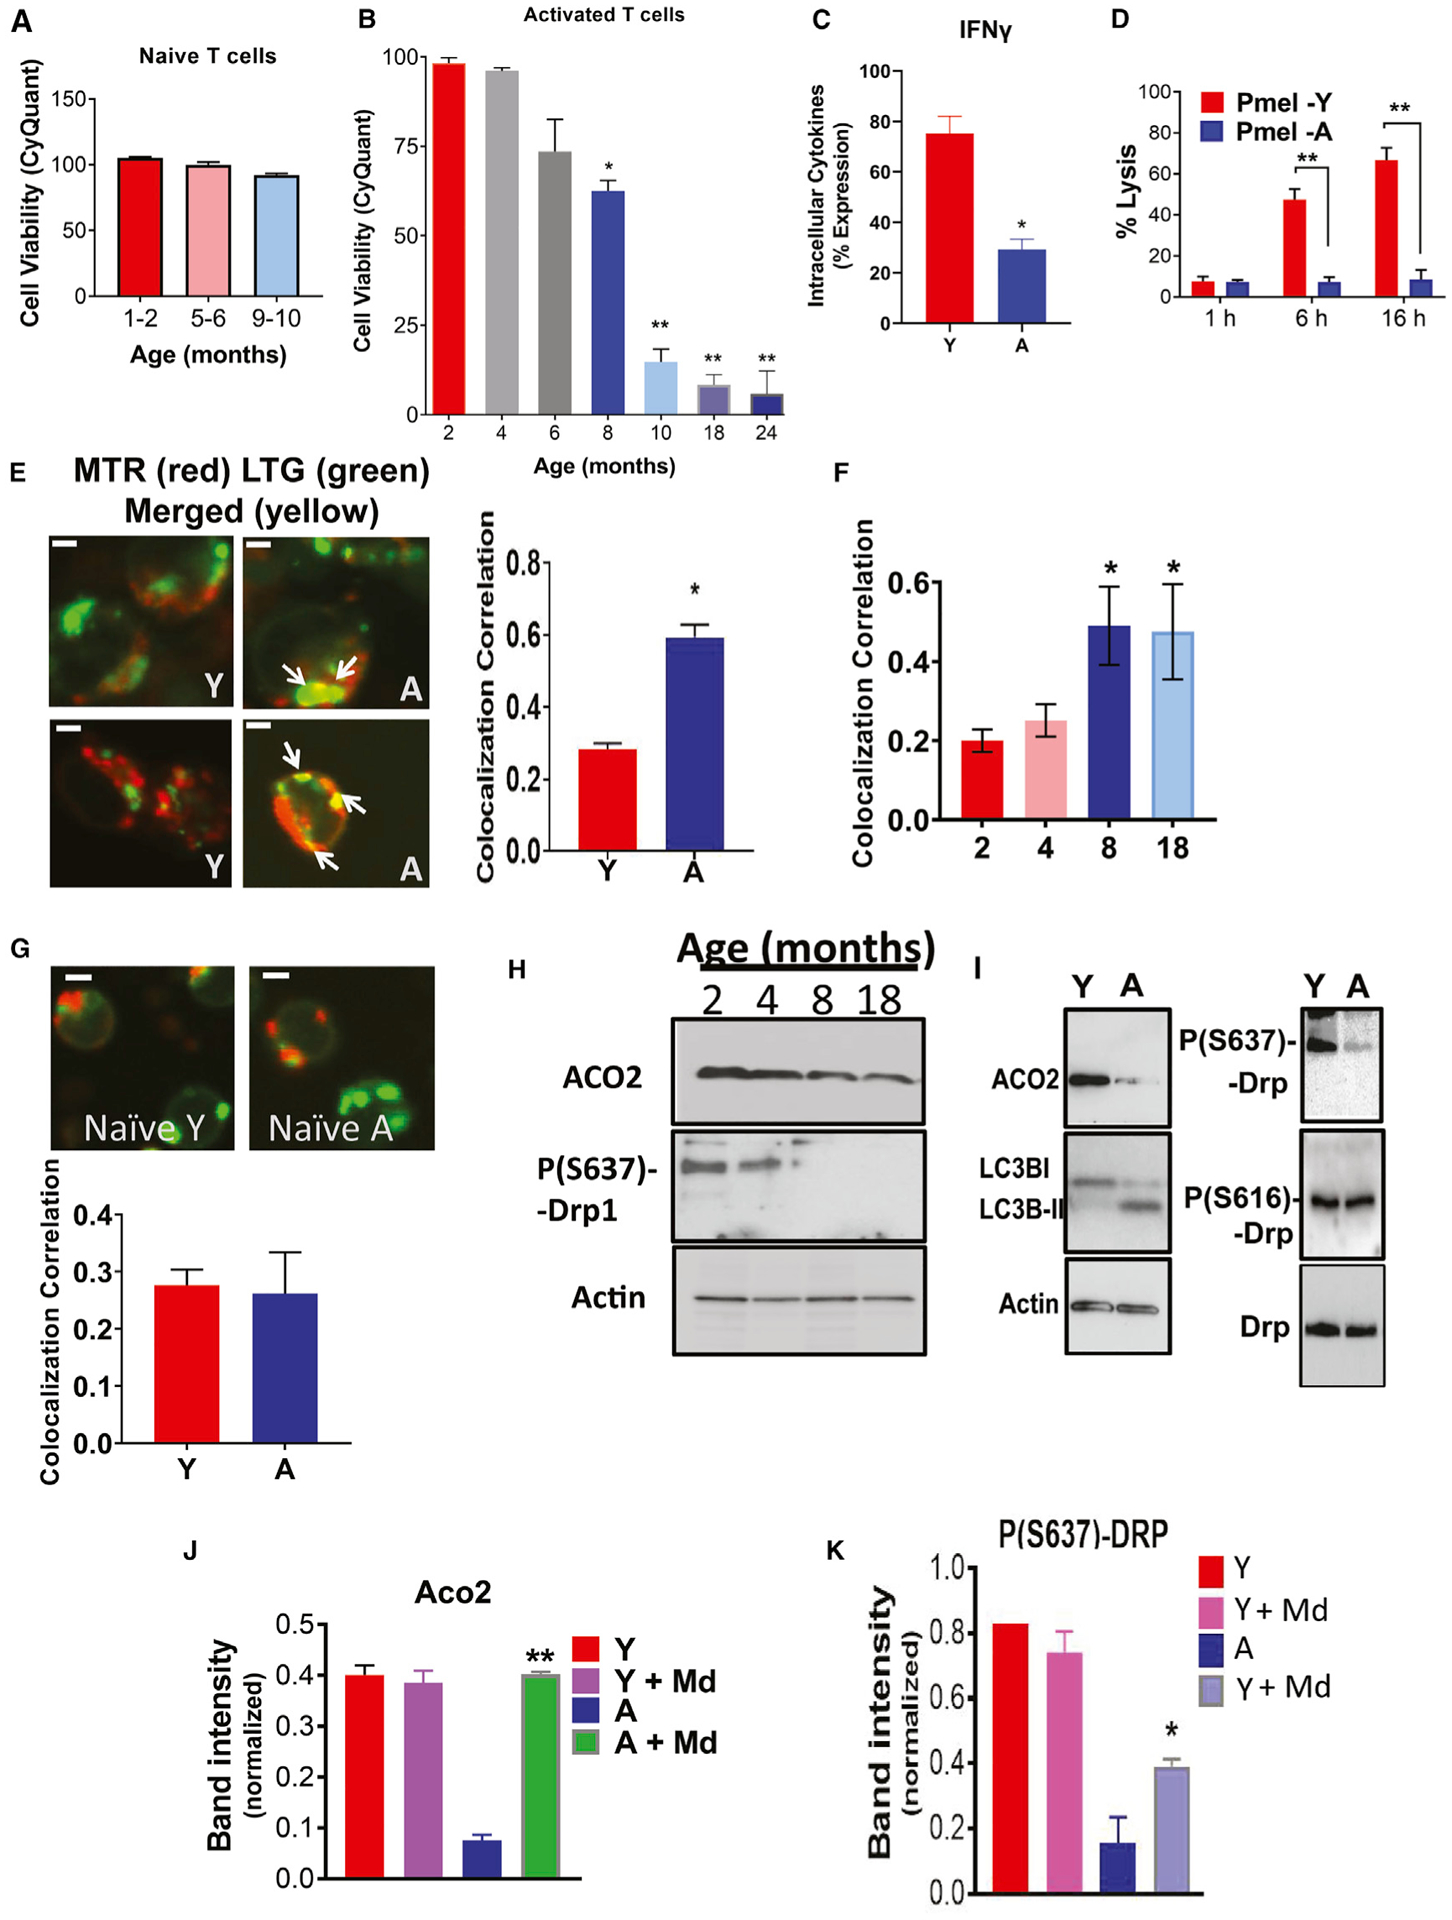
Figure 1. Aging stress attenuates T cell function in part via induction of mitophagy in response to ex vivo TCR activation.

(A and B) Viability of naive (A) or TCR activated (B) T cells isolated from Y or A mice was measured by trypan blue exclusion assay.
(C) Flow cytometry analyses show IFN-γ suppression in activated T cells isolated from A compared to Y mice. Data are means ± SDs from 3 independent experiments (n = 3). *p < 0.05 as determined by Student’s t test.
(D) The ability of aging Pmel T cells to kill B16 melanoma cancer cells in co-cultures is impaired compared to T cells isolated from Y mice. Data are means ± SDs from 3 independent experiments (n = 3). **p < 0.01 as determined by Student’s t test.
(E and F) Mitophagy of Y (isolated from 2- and 4-month-old mice) and A (isolated from 8- and 18-month-old mice) activated T cells were measured by live-cell imaging using confocal microscopy stained for mitochondria (MITO; MitoTracker Red [MTR]) and lysosomes (LysoTracker Green [LTG]). Scale bars, 1 μm. Micrographs represent at least 3 independent experiments of Y and A T cells (E). The right panel shows the quantification of colocalization extracted from the coefficient of colocalization (Rc). White arrows indicate merged (yellow). Scale bars, 1 μm. Quantification of colocalization extracted from the coefficient of colocalization (Rc) using the Fiji software (F). Data are means ± SDs from 3 independent experiments (n = 3). *p < 0.05 as determined by Student’s t test.
(G) Live-cell imaging of naive Y and A T cells, stained MITO (MTR) and lysosomes (LTG). Scale bars, 1 μm. Micrographs represent at least 3 independent experiments of Y and A T cells. The bottom panel shows the quantification of colocalization extracted from the coefficient of colocalization (Rc). Data are means ± SDs from 3 independent experiments (n = 3).
(H and I) Western blot measuring the levels of ACO2 and P-S637-Drp1 in activated T cells from Y (2- and 4-month-old), and A (8- and 18-month-old) mice. Protein expression was normalized to β-actin. (I) Western blot measuring cytoplasmic levels of LC3B-I, LC3B-II, and ACO2 (H), or total-Drp1, P-(S637)-Drp1, and P-(S616)-Drp1 (I), in activated T cells from Y and A mice.
(J and K) Western blot to detect P-S637-Drp1 (J) and ACO2 (K) in activated T cells with/without mitophagy inhibitor mDivi (Md). Data are means ± SDs from 3 independent experiments (n = 3). *p < 0.05, **p < 0.01 as determined by Student’s t test.
