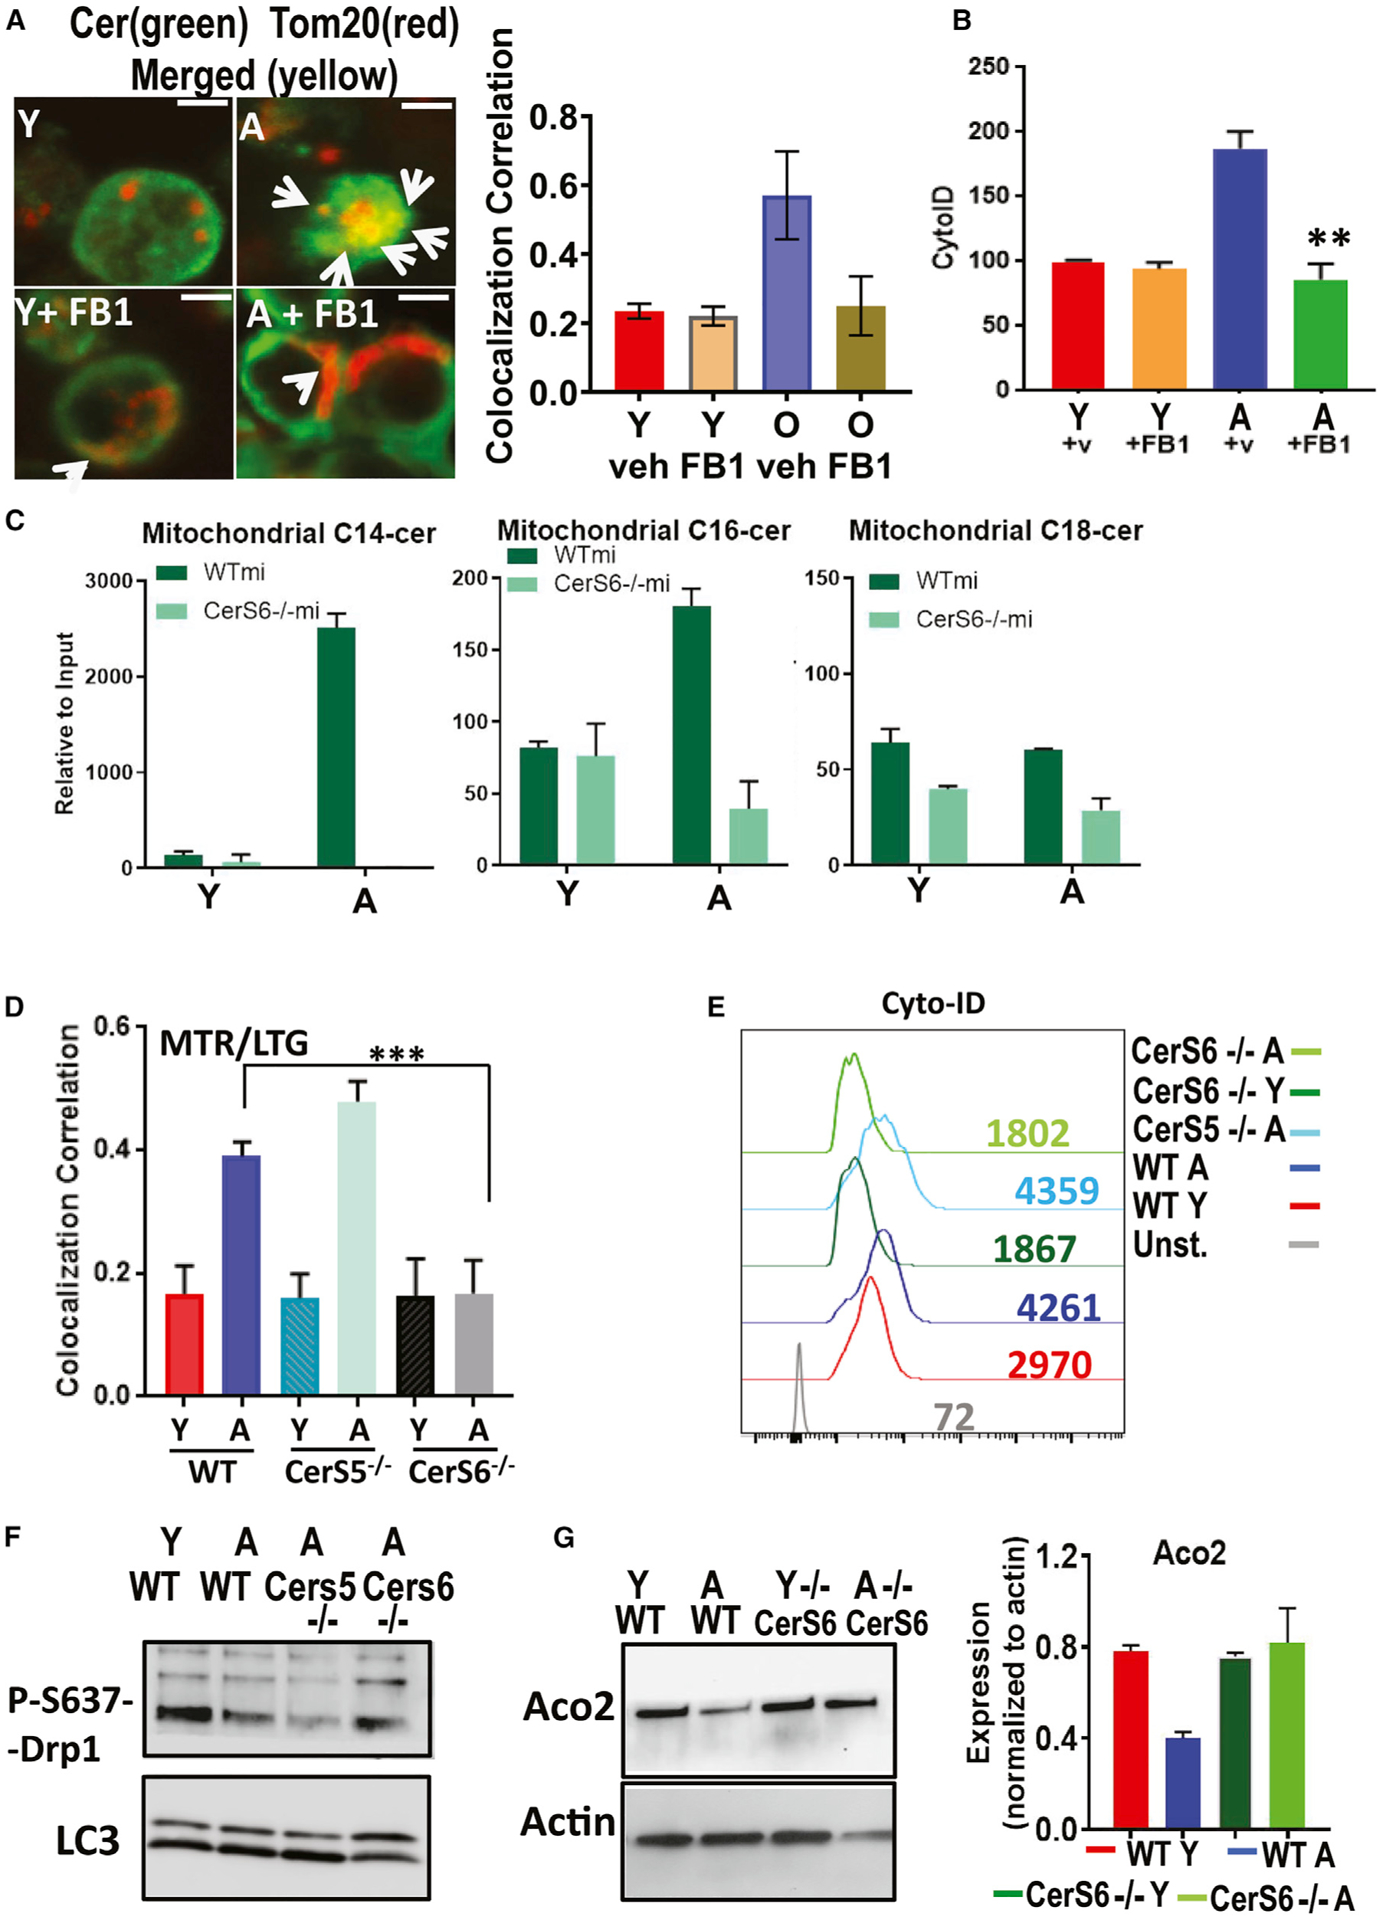
Figure 2. Aging induces mitochondrial CerS6/C14 ceramide and mediates mitophagy in activated T cells.

(A) Confocal microscopy for Y and A T cells with/without FB1 dual labeled with TOM20 (red, mitochondrial marker), and ceramide (green) fluorescent antibodies. White arrows indicate merged (yellow). Scale bars, 1 μm. Images represent at least 3 independent experiments. The right panel shows the quantification of colocalization extracted from the coefficient of colocalization (Rc). Data are means ± SDs from 3 independent experiments (n = 3).
(B) Autophagy was measured staining with CytoID followed by flow cytometry of 3-day activated Y and A T cells with/without FB1. Data show means ± SDs from 3 independent experiments (n = 3). **p < 0.01 as determined by Student’s t test.
(C) High-performance liquid chromatography-tandem mass spectrometry (HPLC-MS/MS) measurements of C14 ceramide (left), C16 ceramide (center), and C18 ceramide (right) in activated T cells isolated from Y and A mice. Data are means ± SDs from 3 experiments (n = 3). *p < 0.05 as determined by Student’s t test.
(D) Mitophagy was detected by live-cell imaging for measuring the colocalization of MTR-LTG in T cells obtained from Y and A WT, CerS5−/− and CerS6−/− mice. Quantification of colocalization was performed using the coefficient of colocalization (Rc). Data are means ± SDs from at least 3 experiments (n = 3). ***p < 0.001 as determined by Student’s t test.
(E–G) LC3/autophagy activation was measured by cyto-ID (E), and protein abundance of P-S637-Drp1 and LCBI/LCBII (F) or ACO2 and actin (G) were measured using extracts of activated T cells isolated from Y and A WT, CerS5−/−, and/or CerS6−/− mice. These data represent at least 3 independent experiments (n = 3). Data are means ± SDs from 3 independent experiments (n = 3).
