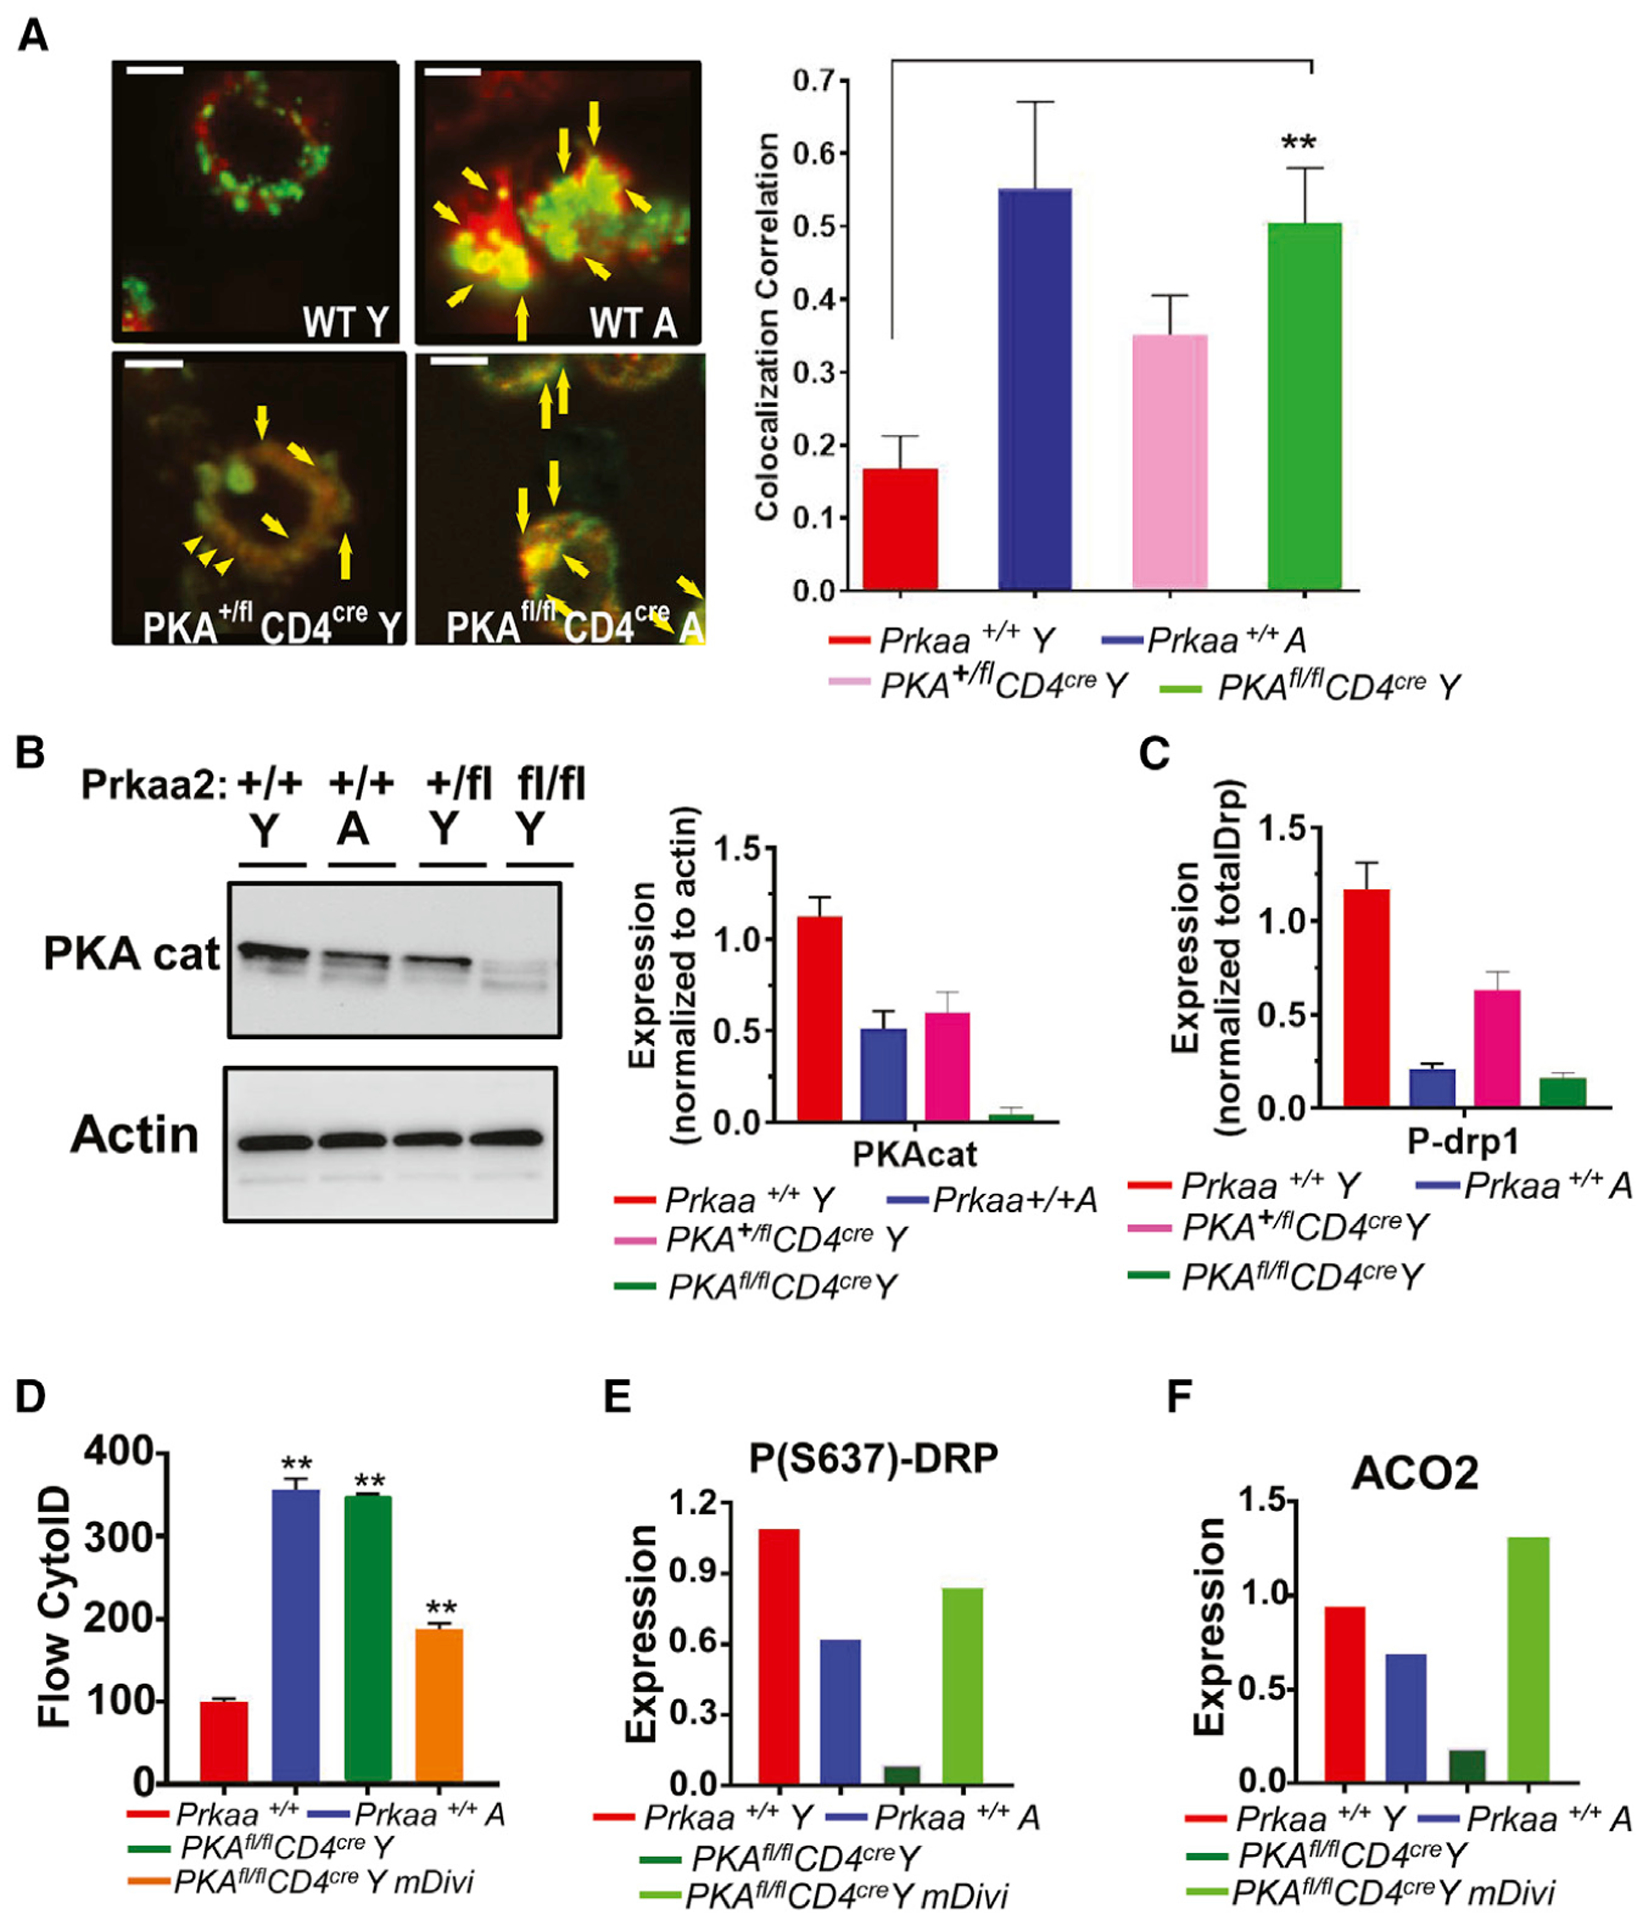
Figure 6. Mitophagy is induced in activated T cells obtained from young T cell-specific PKAc−/− mice.

(A) T cells obtained from Y and A WT or 1 or 2 alleles targeted mutation of murine PKA (Prkaa2) PKA+/fl CD4cre and PKAfl/fl CD4cre mice were analyzed using live-cell microscopy for MTR-LTG colocalization. Arrows indicate merged (yellow); scale bars: 1 μm. Images represent at least 3 independent experiments. The right panel shows the quantification of colocalization extracted from the coefficient of colocalization (Rc). Data are means ± SDs from 3 independent experiments (n = 3). **p < 0.01 as determined by Student’s t test.
(B and C) Western blotting was performed to detect PKAc (cat) (B) or P-(S637)-Drp1 (C) in T cells obtained from Y and A WT or Y Prkaa2 knockout mice (PKA+/+ and PKA+/fl CD4cre and PKAfl/fl CD4cre). The quantification of PKAc abundance was shown in the right panel in (B). Data are means ± SDs from 3 independent experiments (n = 3).
(D–F) Mitophagy/autophagy was detected in T cells isolated from Y and A PKA+/+, and PKA+/fl CD4cre, and PKAfl/fl CD4cre mice in the absence/presence of mDivi for the measurement of cyto-ID (D) using flow cytometry, or P(S637)-Drp1 and ACO2 using western blotting. Data are means ± SDs from at least 3 experiments (n = 3). **p < 0.01 as determined by Student’s t test.
