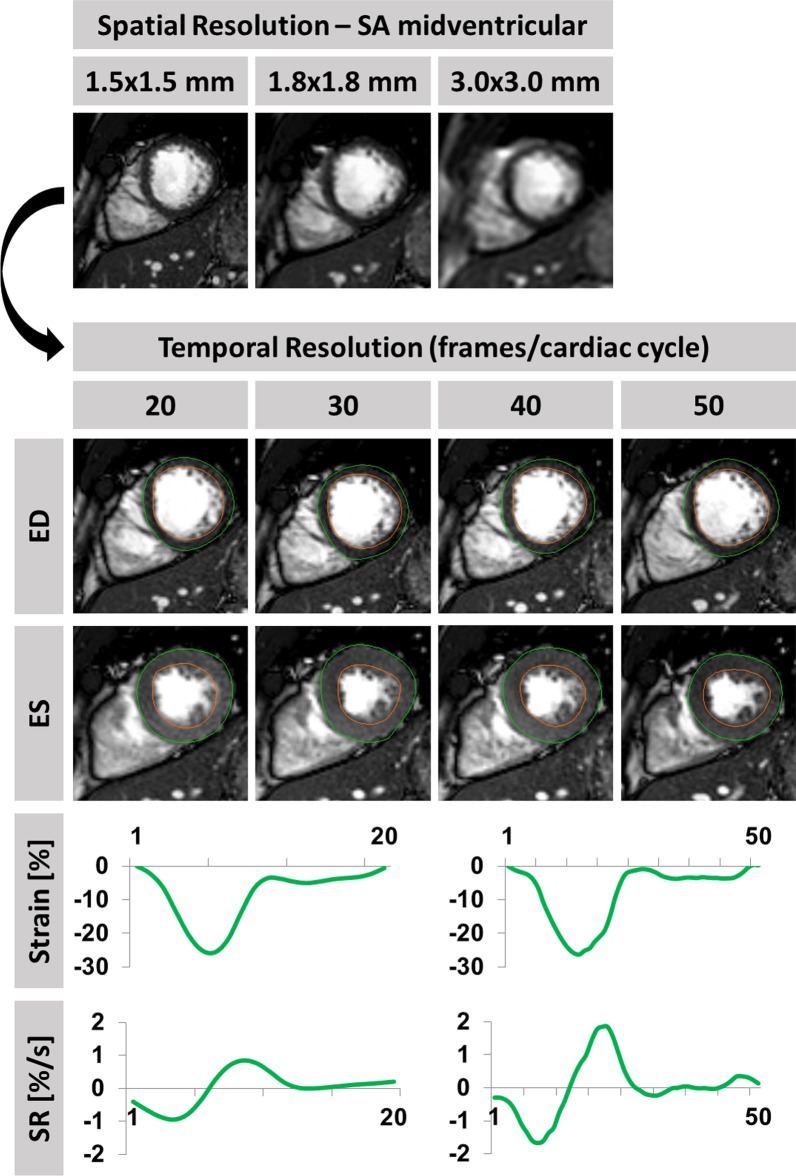
Fig. 1.
Strain and strain rate (SR) analyses with different spatial and temporal resolutions. Example of a healthy subject and end-diastolic mid left ventricular short axis views using high (1.5 × 1.5 mm in plane and 5 mm through-plane), standard (1.8 × 1.8 mm in plane and 8 mm through-plane) and low (3.0 × 3.0 mm in plane and 10 mm through-plane) spatial resolutions. Below different temporal resolutions of 20, 30, 40 and 50 frames/cardiac cycle in high spatial resolution (1.5 × 1.5 mm in plane and 5 mm through-plane) with traced borders at end-diastole (ED) and end-systole (ES) are displayed. Strain and strain rate (SR) curves for global circumferential strain (GCS) are exemplary shown for high spatial with either lowest (20) or highest (50) temporal resolution. Final strain values are based on endocardial strain only

