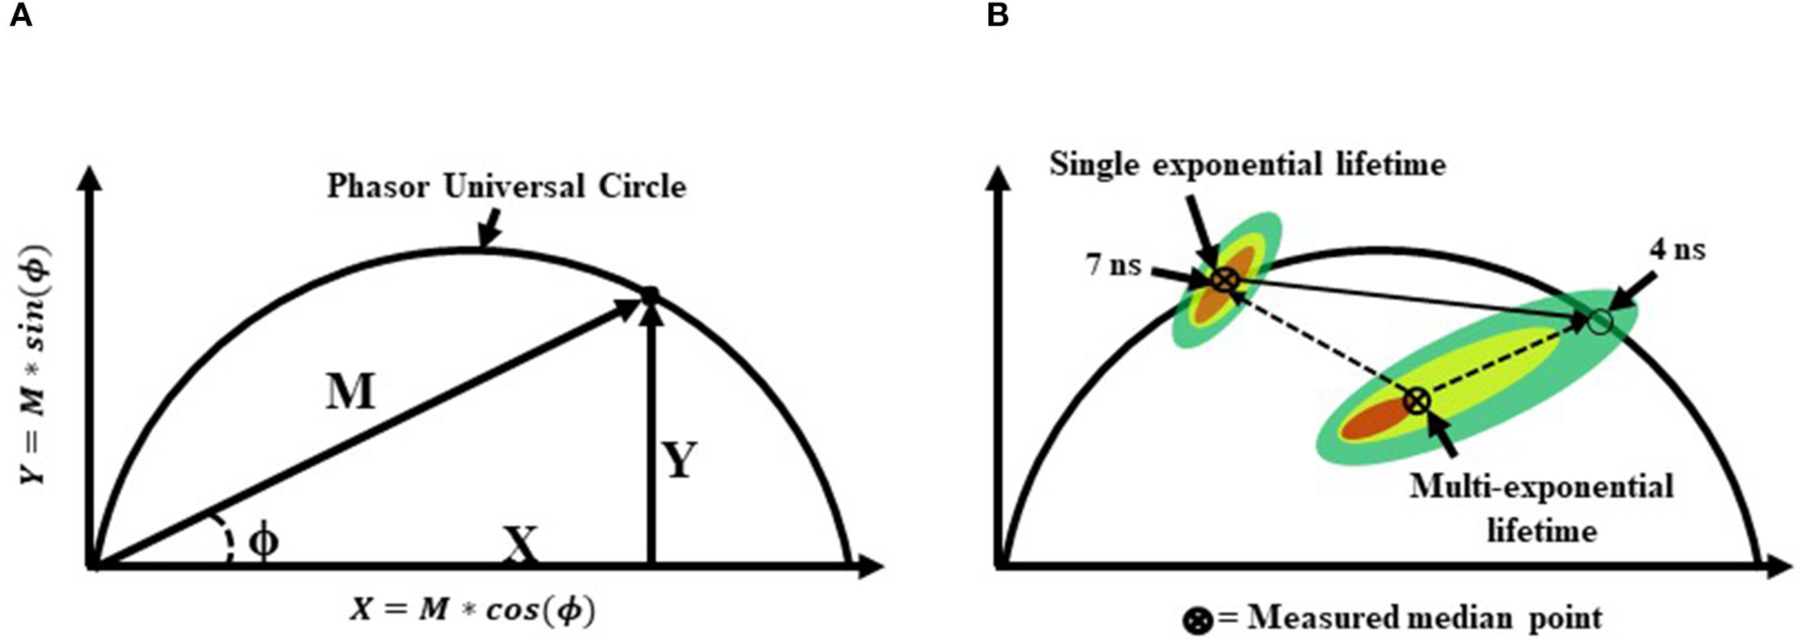
FIGURE 7 |.

(A) A graphical representation of a phasor graph. Raw data is transposed to the frequency domain by applying a discrete Fourier transform. Data are visualized in a frequency spectrum where the phase (ϕ) and modulation (M) factors are extrapolated to construct the phasor graphs. Calculated events that fall directly on the phasor universal circle represent a single exponential lifetime, whereas calculated events falling within the phasor universal circle represent multiple exponential lifetimes. Alternatively, it is possible to gain insight into the weighted mean lifetime by calculating fractional contributions of different lifetime components using lifetime component vectors as represented in part (B).
