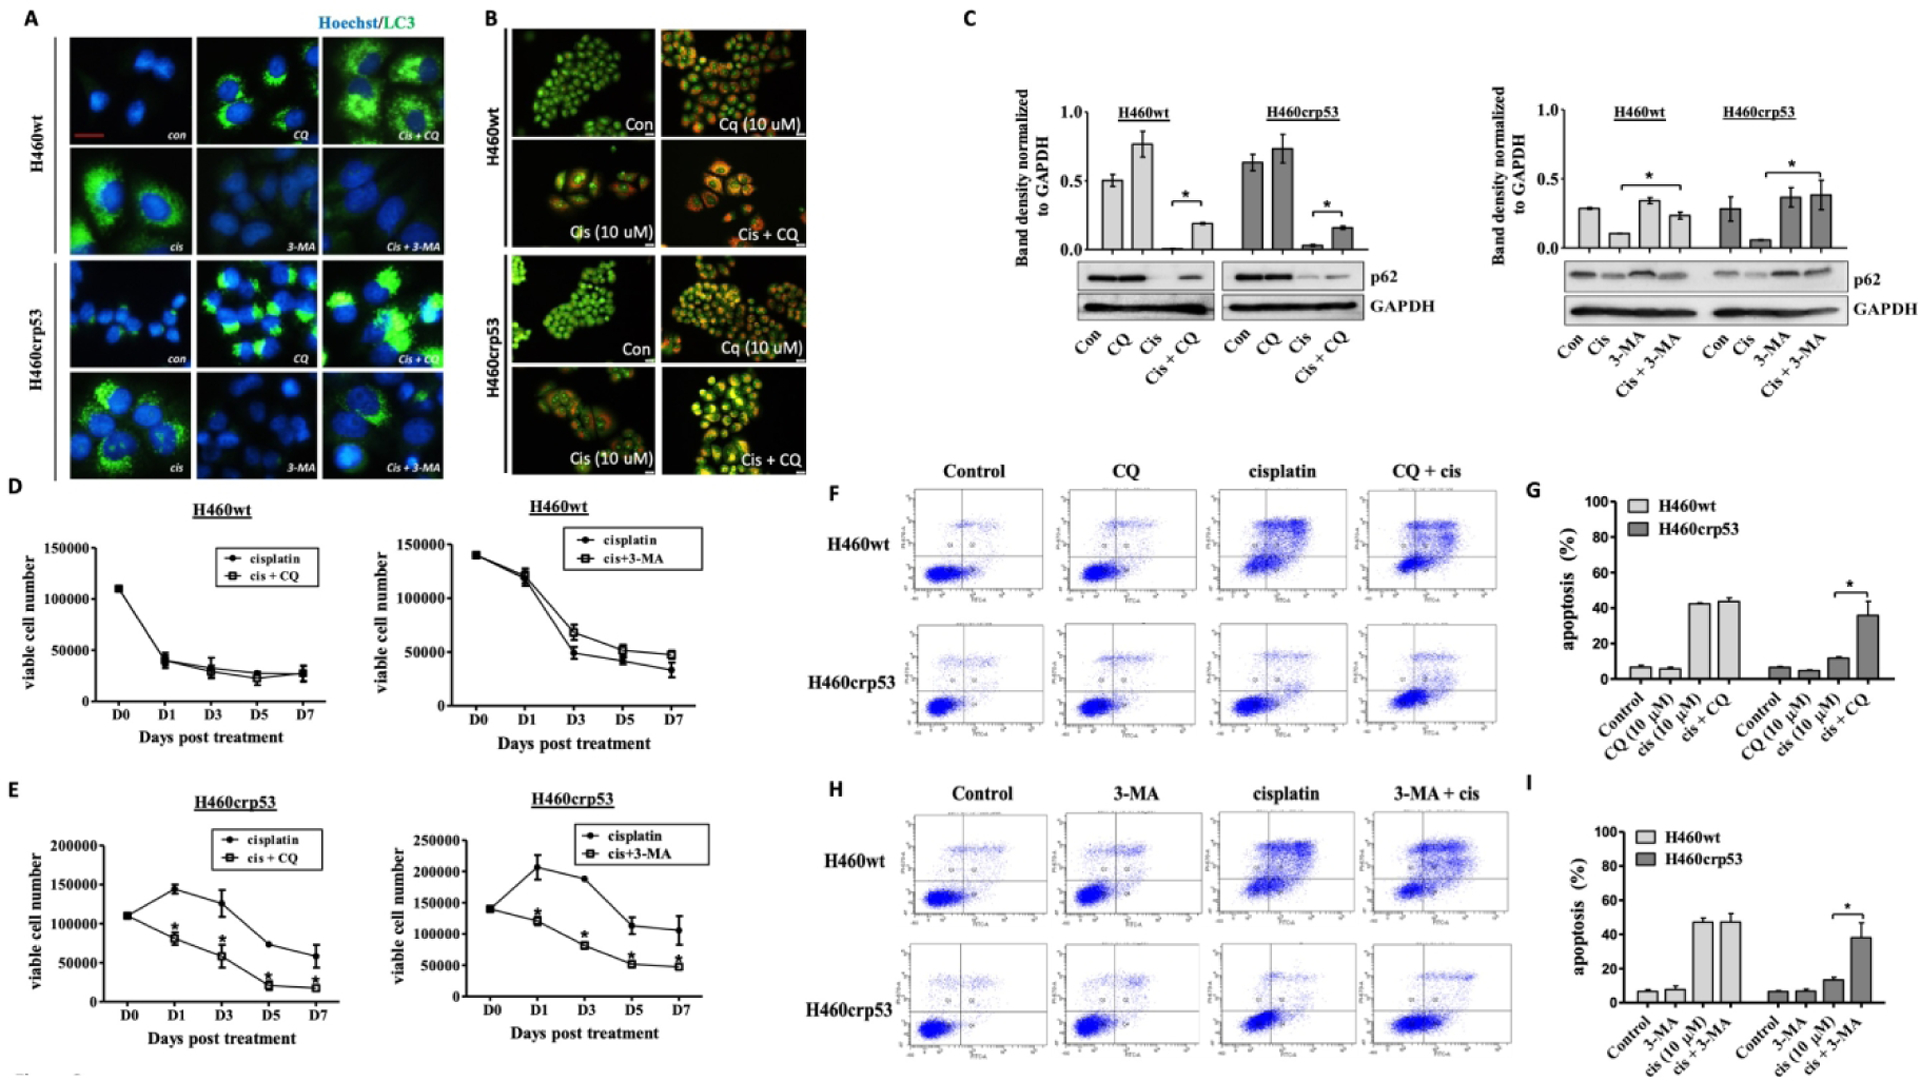
Figure 3. Influence of pharmacologic autophagy inhibitors on cisplatin sensitivity in H460wt cells and H460crp53 cells.

A. Inhibition of autophagy by CQ and 3-MA. Fluorescence microscopy showing increased LC3 puncta following CQ (10 μM) co-treatment with 10 μM cisplatin, and decreased LC3 puncta following 3-MA (1 mM) co-treatment with 10 μM cisplatin. Cells were pretreated with CQ (10 μM) and 3-MA (1 mM) followed by an additional 24 h with cisplatin. Images were taken 48 h after cisplatin removal. Nuclei were stained with Hoechst 33342 and vacuoles with LC3 antibody (20x objective, n=2). B. Inhibition of autophagy by CQ. Cells were pretreated with CQ (10 μM) followed by an additional 24 h with cisplatin. Acridine orange staining and imaging was performed taken 48 h after 10 μM cisplatin removal (20x objective, n=3). C. Inhibition of autophagy by CQ and 3-MA. Western blot showing autophagy blockade by CQ (10 μM) and 3-MA (1 mM) based on levels of p62/SQSTM1 (n=3). The bar graph in each panel indicates the relative band intensity generated from densitometric scans of two independent experiments in arbitrary densitometric units. D and E. Influence of autophagy inhibition on cisplatin sensitivity. Viability of H460wt cells and H460crp53 cells was monitored based on trypan blue exclusion at indicated days following 10 μM cisplatin exposure in combination with CQ (10 μM) or 3-MA (1 mM) (n=3). F-I. Influence of autophagy inhibition on cisplatin induced apoptosis. Annexin V-PI staining showing influence of CQ (10 μM) and 3-MA (1 mM) on apoptosis of H460 cells exposed to cisplatin (10 μM). Cells were pretreated with CQ or 3-MA for 3 h followed by co-treatment with cisplatin for 24 h. Apoptosis was measured 24 h after cisplatin removal. (E and G) Representative images of flow cytometry data and (F and H) quantification of fluorescence was graphed (n=3). Unless stated otherwise, data were from three independent experiments, *p<0.05, cisplatin versus cisplatin + CQ (3-MA).
