
FIGURE 2.
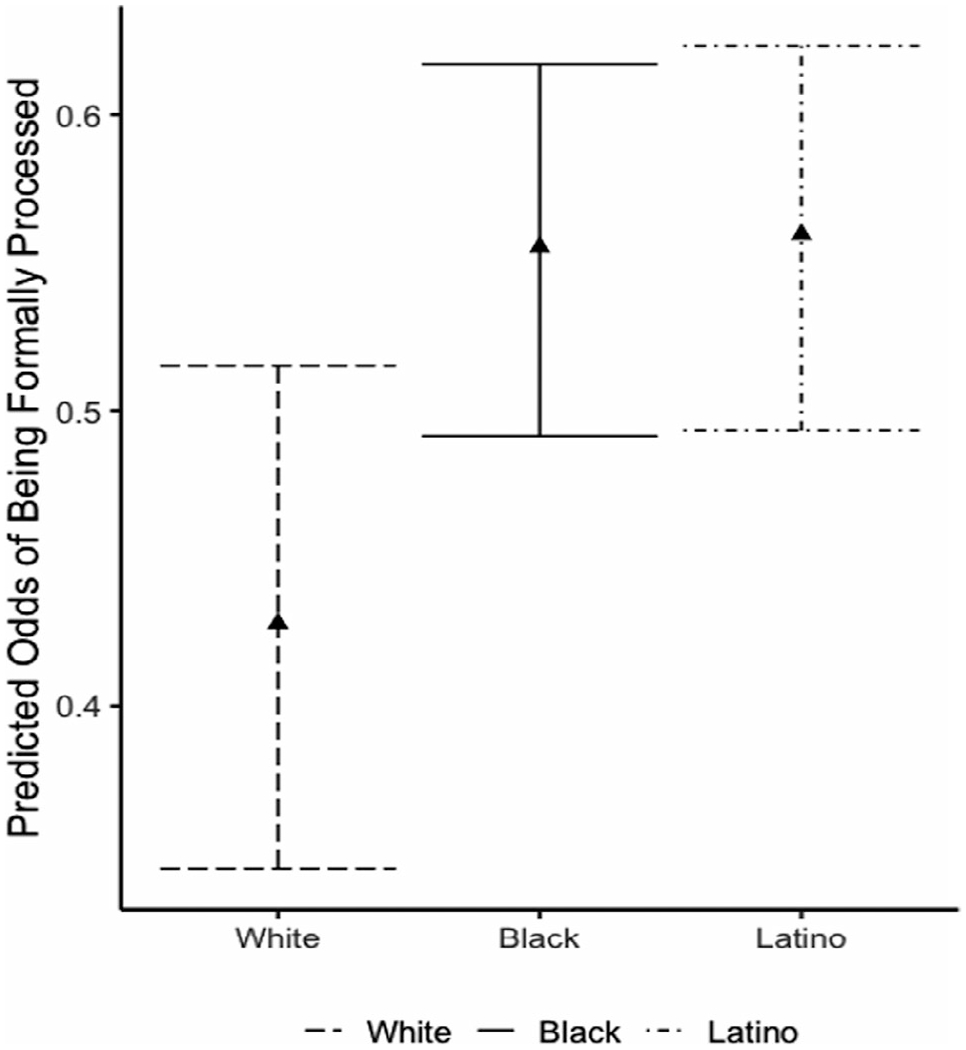
Estimated predicted odds of being formally versus informally processed, controlling for parental education, neighborhood quality, age at arrest, data collection site, history of self-reported offending, and whether the index offense was violent. Estimated odds are shown for White youth (dashed line), Black youth (solid line), and Latino youth (dot-dashed line). Results from the logistic regression demonstrate that race significantly predicts whether youth are formally processed, such that both Black and Latino youth are more likely to be formally processed relative to White youth.