
Figure 3. Tumor volume and event-free survival with m276-SL-PBD administration.
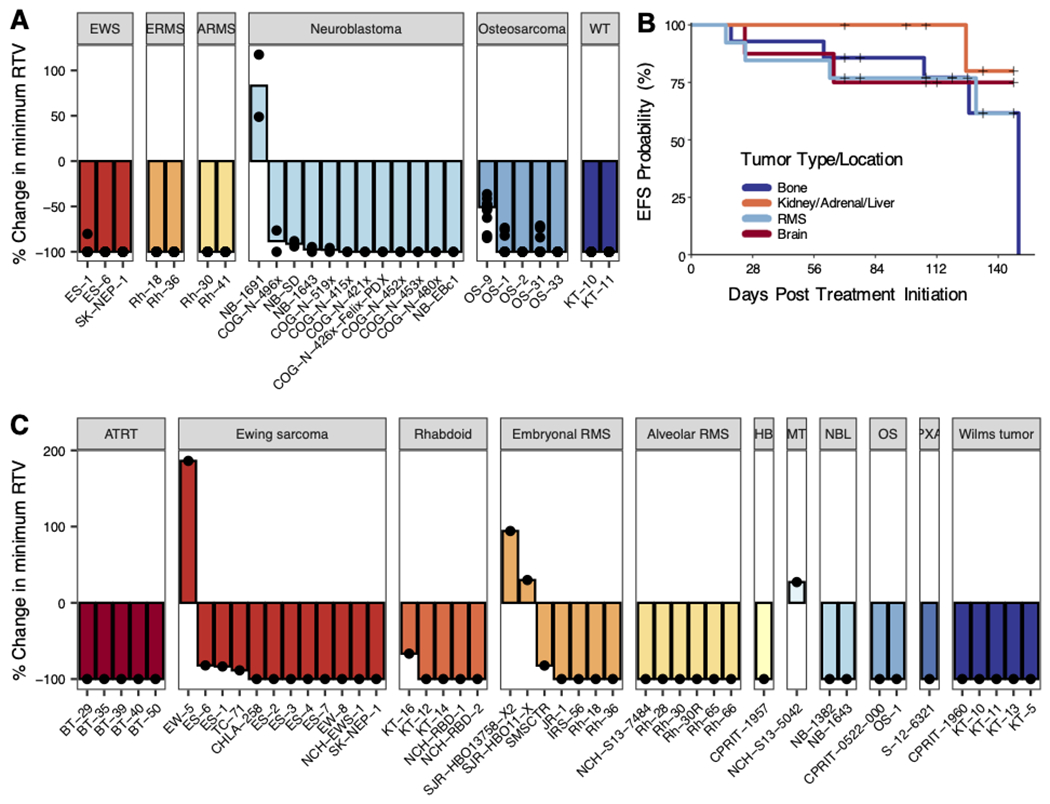
A) Waterfall plots for Ewing sarcoma (10 mice per model), rhabdomyosarcoma (10 mice per model), osteosarcoma (10 mice per model), and neuroblastoma (2 mice per model) PDX/CDXs. Bars represent median percent change in minimum relative tumor volume in treated mice. B) Kaplan-Meier plot of all 47 single mouse experiments (N=1) with “+” representing right-censored data. Colors represent the location of tumor origin (bone includes osteosarcoma (2 models) and Ewing sarcoma (12 models); kidney/adrenal/liver includes neuroblastoma (2 models), extracranial Rhabdoid (5 model), hepatoblastoma (1 model), and Wilms tumor (5 models); RMS includes alveolar (6 models) and embryonal RMS (7 models); brain includes ATRT (5 models), PXA (1 model), and meningioma (1 model)). C) Waterfall plots for models in SMT. Bars represent median percent change in minimum relative tumor volume in treated mice.