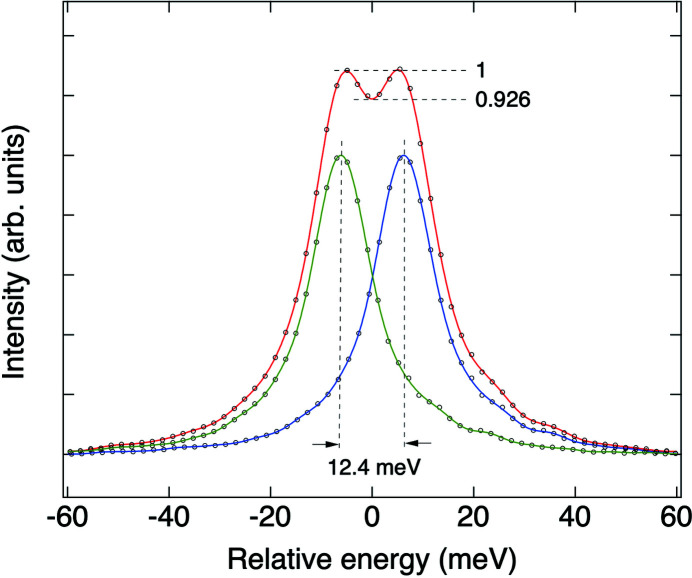
Figure 8.
Elastic scattering spectra of a W/B4C multilayer measured in a near reflection condition at 530 eV. The measured scattering spectrum, which has an FWHM of 14.8 meV, is plotted with black circles, together with a green curve showing its Fourier filtered function. The spectrum plotted along with a blue curve for its Fourier filtered function is a duplicate of this measured spectrum. When the separation between these two spectra is 12.4 meV, the core-to-wing ratio in their summation plotted together with a red curve for its Fourier filtered function is 0.926. The measured spectrum was obtained without applying any pixel elimination with an intensity threshold on the 2D image recorded in 1 s.

