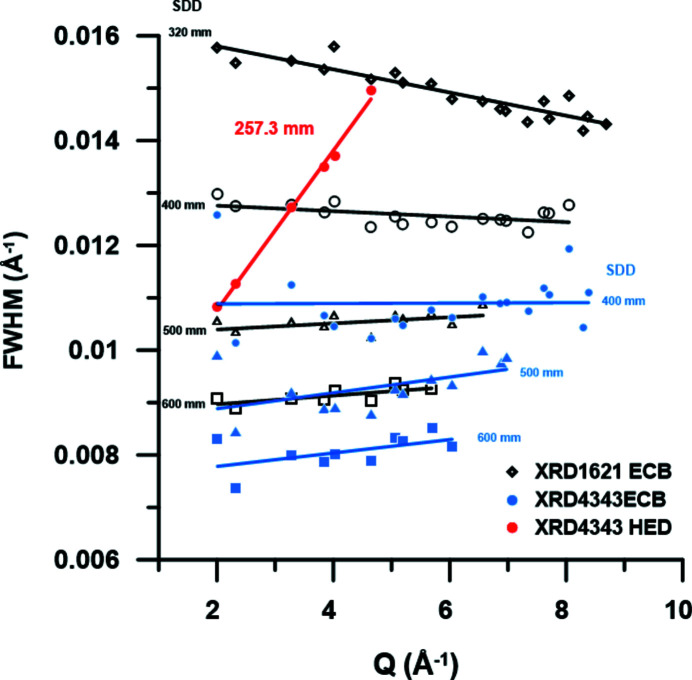
Figure 12.
Comparison of the FWHM of the diffraction peaks of the CeO2 standard (NIST) collected on beamline P02.2 at PETRA III and the HED instrument at the EuXFEL. Comparison of the IR collected on P02.2 at 25.6 keV with a Perkin Elmer XRD1621 (open black symbols) and a VAREX XRD 4343CT (solid blue symbols), and that of the HED instrument at 17.8 keV collected on the VAREX XRD 4343CT (red solid circles) based on the summation of 100 individual patterns. Solid black, blue and red lines are linear fits to the data to guide the eye.

