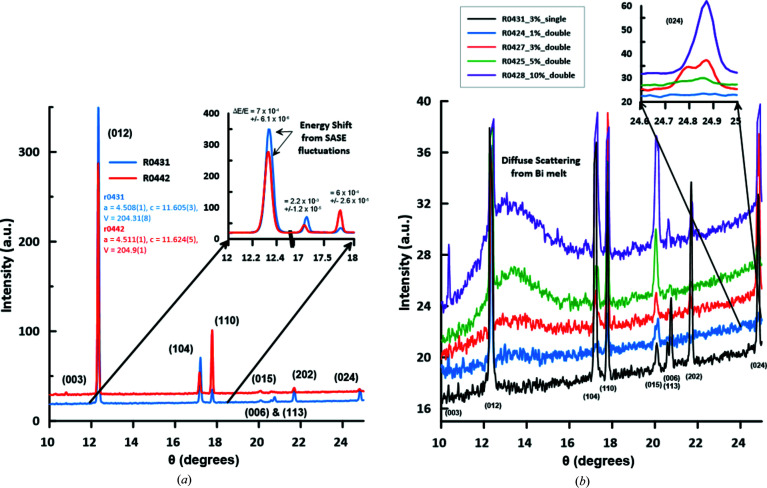
Figure 13.
Integrated diffraction patterns of Bi-I collected on the VAREX XRD 4343CT, demonstrating the high quality of the diffraction patterns obtained from a single X-ray pulse. The diffraction patterns are not background subtracted and are stacked for better visibility. (a) Diffraction patterns of Bi-I collected using a single 20 fs (r.m.s. as determined at 0.25 nC) X-ray pulse at 17.8 keV and at 3% transmission (4 µJ per pulse) where Bi was compressed to 1.49 (2) GPa in a symmetric diamond anvil cell. Variations in the positions of the diffraction peaks are caused by the energy fluctuations of the SASE energy spectrum. Intensity fluctuations in the peaks are due to crystallite orientations changing as a consequence of sample melting and recrystallization. (b) Diffraction patterns of Bi-I collected with two sequential X-ray pulses (r.m.s. as determined at 0.25 nC), 444 ns apart with varying transmission settings. For comparison a single-pulse pattern is also shown, which indicates that even at the lowest transmission of 1% part of the sample had melted following the first pulse, as evident from the diffuse scattering.

