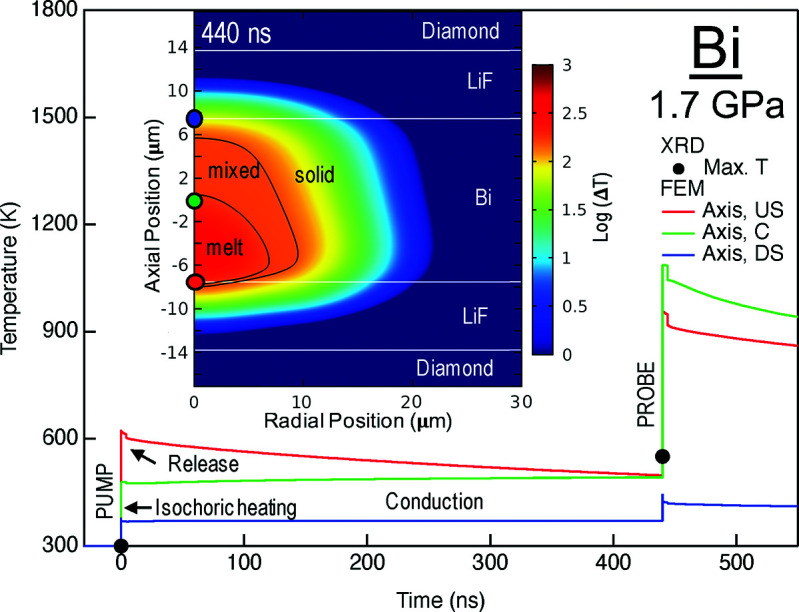
Figure 14.

Temperature history in the Bi sample at 1.7 GPa and 3% transmission based on XRD and finite element modeling. The maximum temperature determined from the thermal expansion model based on diffraction is indicated by black dots. Based on the energies entering the beamline during the shots, 658 (43) µJ at XGM_SA2, we computed the local equilibrium temperature due to isochoric heating, hydrodynamic release and conduction (Meza-Galvez et al., 2020 ▸), including latent heat of melting through the effective heat capacity model and radiative cooling (Gomez-Perez et al., 2017 ▸). Temperature histories at three positions along the axis are shown as colored lines. The inset shows the axisymmetric temperature distribution in the sample area at the time of the probe. The black lines are isotherms indicating the edge of the mixed-phase region in Bi and the colored dots indicate the positions of the corresponding temperature histories. The model uses thermal parameters [see Meza-Galvez et al. (2020 ▸) for notation] appropriate for hot compressed Bi [ρ = 10.22 g cm−3, CV = 120 J kg−1 K−1, CP = 139 J kg−1 K−1, k = 8 W m−1 K−1, γ0 = 1.25 (Gorman et al., 2015 ▸), β = 4 × 10⁻⁵ K−1, melting temperature of 470 K (Ono, 2018 ▸), latent heat of 52 kJ kg−1 and radiative emissivity of 0.33]. Values for the LiF PTM, diamond and gasket are taken from Meza-Galvez et al. (2020 ▸). X-ray absorption (and attenuation) factors at 17.8 keV are 119 048 m−1, 275 m−1 and 161 m−1 for Bi, LiF and diamond, respectively. Diamond thicknesses were 1.7 mm, the cavity thickness determined from white-light interference was 27.5 µm and the Bi layer thickness measured by X-ray absorbance was 15 µm.
