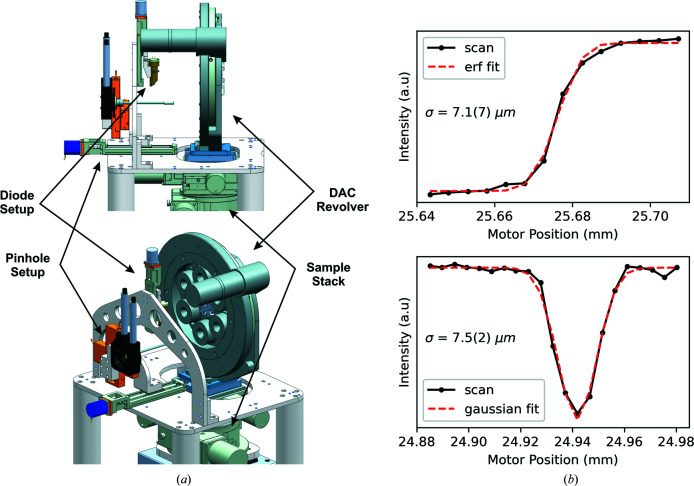
Figure 5.
(a) A 3D model of the pinhole and diode I 0 setup of the DAC setup in IC2. (b, top) Round-edge and (b, bottom) crosshair absorption scans collected by normalizing the intensity I 1 of the DIM in the beamstop [PD_3(BS_att)] to the I 0 of the DIM before the sample, using 14 keV X-rays during commissioning.

