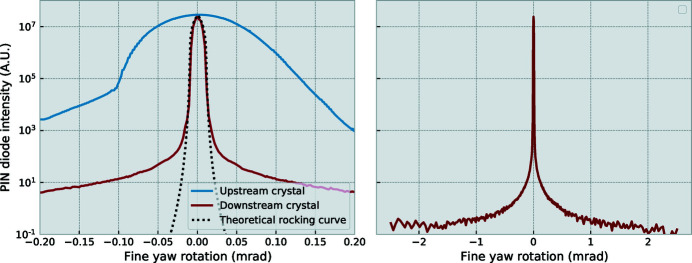
Figure 4.
Left: rocking curves of the crystals on the upstream and downstream rotations, as well as a simulated four-reflection Si(220) rocking curve. These demonstrate that the maximum intensity is not significantly reduced by the second crystal, and that the rocking curve largely matches an ideal crystal. Right: rocking curve of the downstream crystal over the normal scan range showing the dynamic range available for measurements. The vertical scale on the right-hand side matches that of the left.

