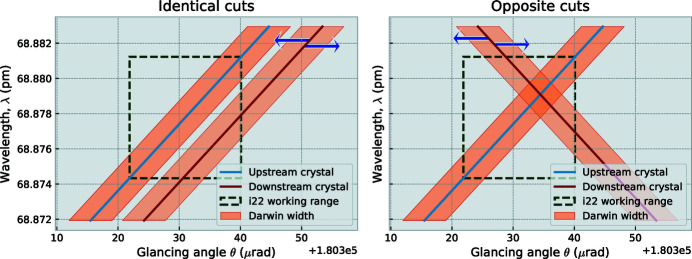
Figure 5.
DuMond diagram showing the configuration of the module with parallel-cut crystals (left) and opposite-cut crystals (right). Blue arrows indicate the shift of the pass-through window upon rotation of the crystal. Overlap between the two bands signifies X-rays being reflected through both crystals. The vertical scale on the right-hand side matches that of the left.

