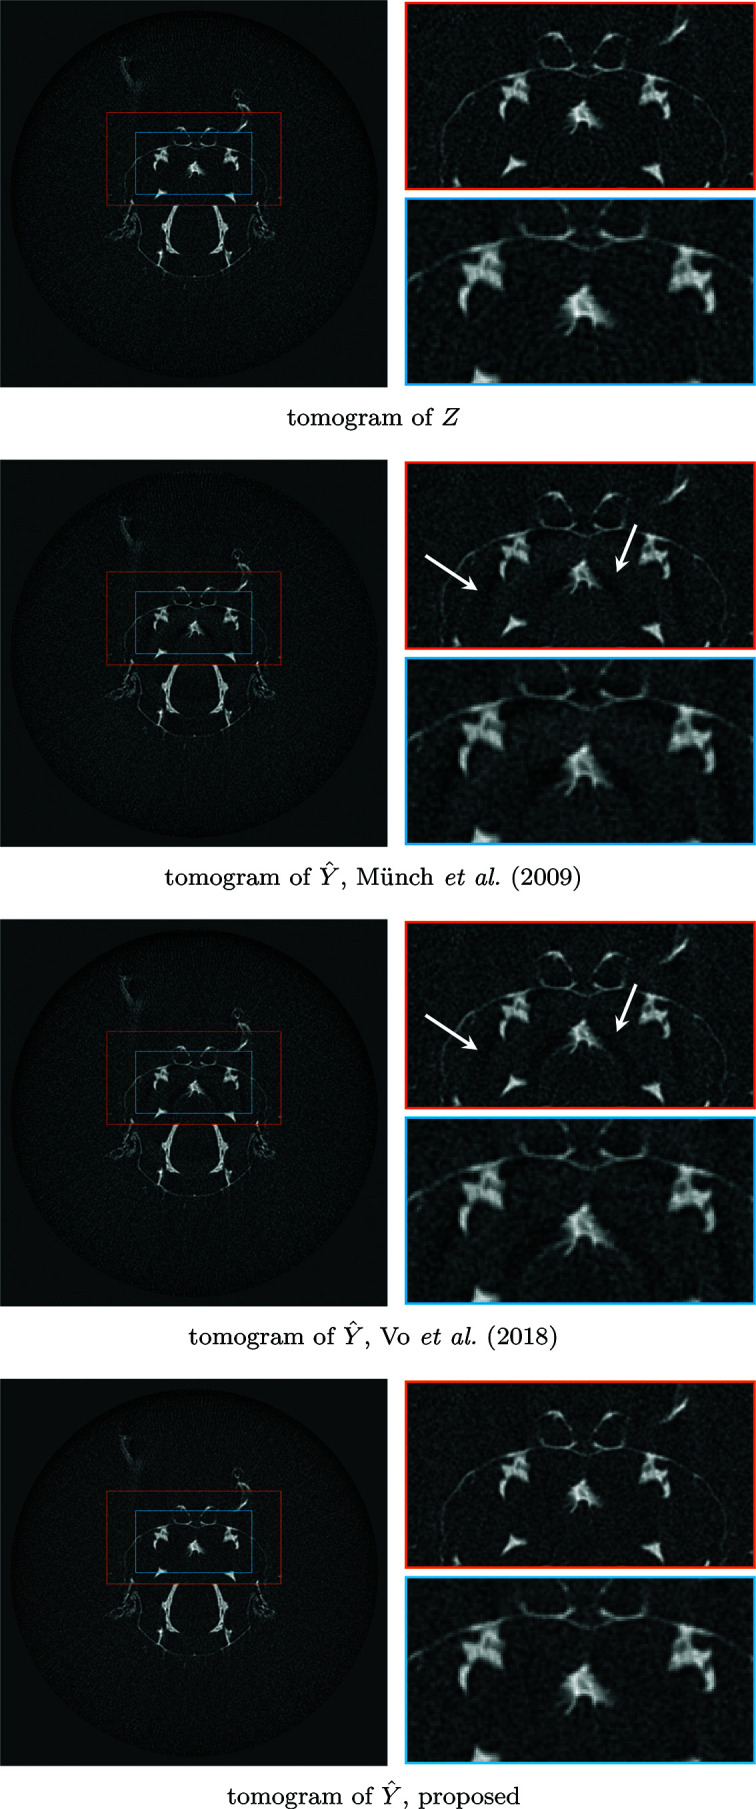
Figure 13.

Comparison of resulting tomograms after different denoising procedures on the second sinogram of Fly shown in Figure 12 ▸. Top to bottom: noisy reconstructed object; Münch et al. (2009 ▸) ▸; Vo et al. (2018 ▸) ▸; proposed procedure based on BM3D denoising. Although all methods achieve good results in removing the streaks, both Münch et al. (2009 ▸) ▸ and Vo et al. (2018 ▸) ▸ introduce strong shadows absent from the proposed estimate, as indicated by the arrows.
