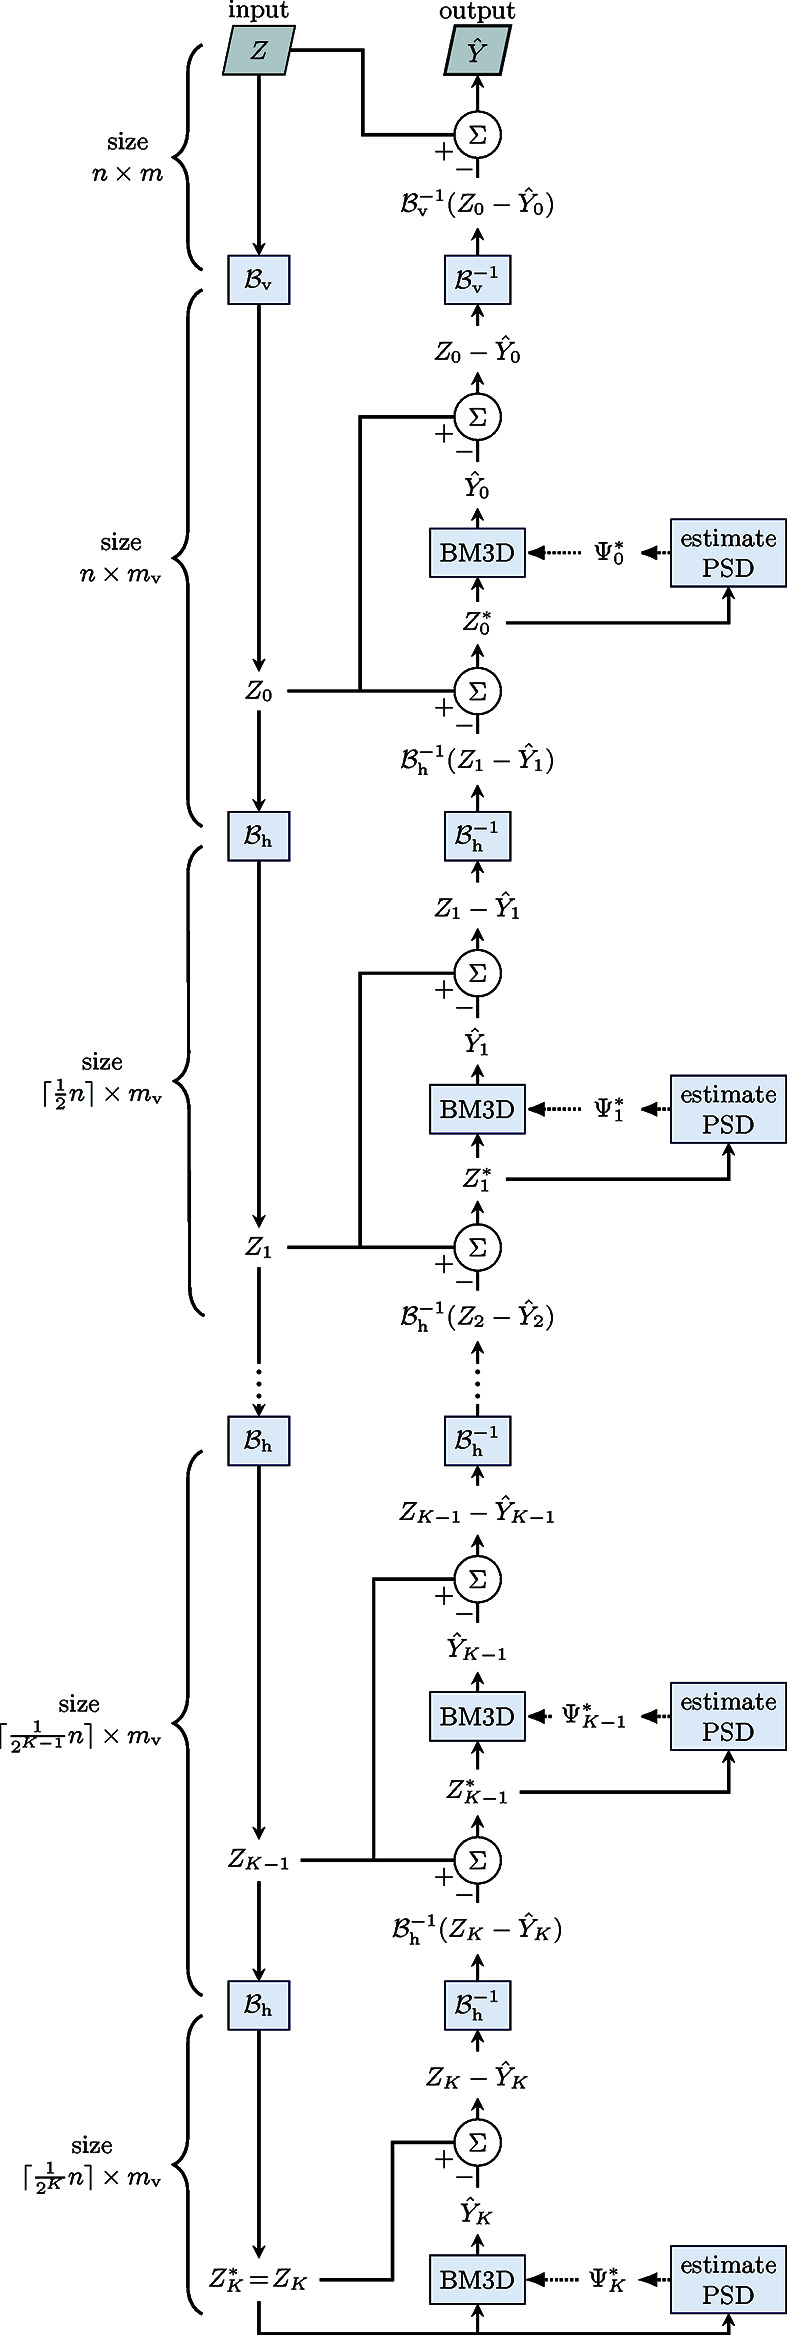
Figure 5.

Flowchart of the multiscale denoising process, starting from the noisy sinogram Z and resulting in the estimate  of the streak-free sinogram, both of size
  . First, Z is vertically rescaled into a sinogram Z
0 of size
  ,
,  , through the binning operator
  . Then, by repeated horizontal binning
  , Z
0 is progressively downscaled into a series of sinograms
  ,
,  , each of size
  . The coarsest scale noisy input
  is denoised with BM3D to produce
  . Then, recursively for
  , the noisy input
  is denoised by BM3D to produce
  ; this definition of
  means that the coarse-scale horizontal components of Z
k are replaced by
  . The PSD for each scale is estimated as described in Section 3.3.2. The resulting estimate
  of the horizontal debinning (size
  ) similarly replaces the coarse-scale vertical components of Z to obtain the full-size estimate
  .
.
