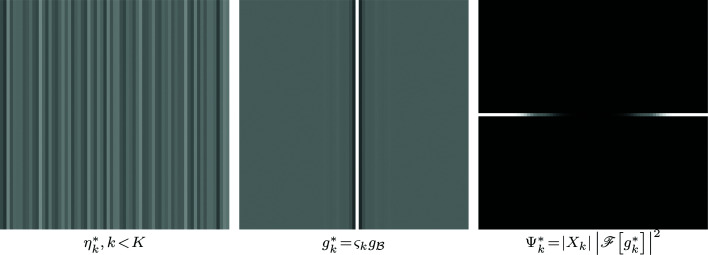
Figure 7.
Example of noise  of
of  ,
,  , the correlation kernel
  where
where  is produced by
  and
and  , and the corresponding PSD
  . For the kernel, 50%-gray pixel color in the figure corresponds to value 0 in the data; for the PSD, black is 0. Note the missing low frequencies at the center of the PSD, and the higher-frequency nature of
  compared with the white streak noise η in Figure 1 ▸.

