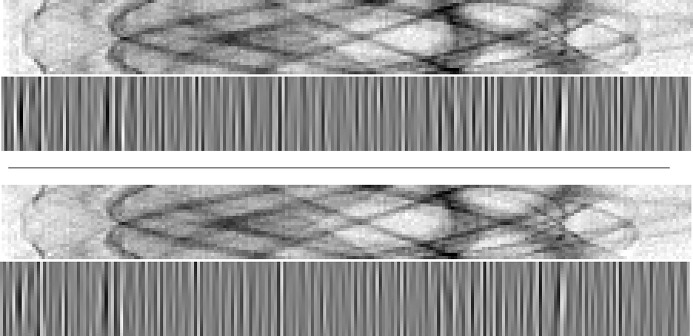
Figure 8.
A fragment of Z
0 of Fly and the corresponding  (top), and a fragment of
  with the corresponding
  (bottom). For
  and
and  , 50%-gray pixel color in the figure corresponds to value 0 in the data. Note how most of the signal of the sinogram fragments is not present in the convolved arrays, facilitating the estimation of the streak noise statistics. Although
  and
and  look very similar, careful visual inspection reveals slight differences similar to those between
  in Figure 1 ▸ and
  in Figure 7 ▸.

