
FIGURE 1. TWO-YEAR POST-RTS LANDING SYMMETRY COMPARISONS BETWEEN RTS QUADRICEPS GROUPS (color not necessarily needed in print).
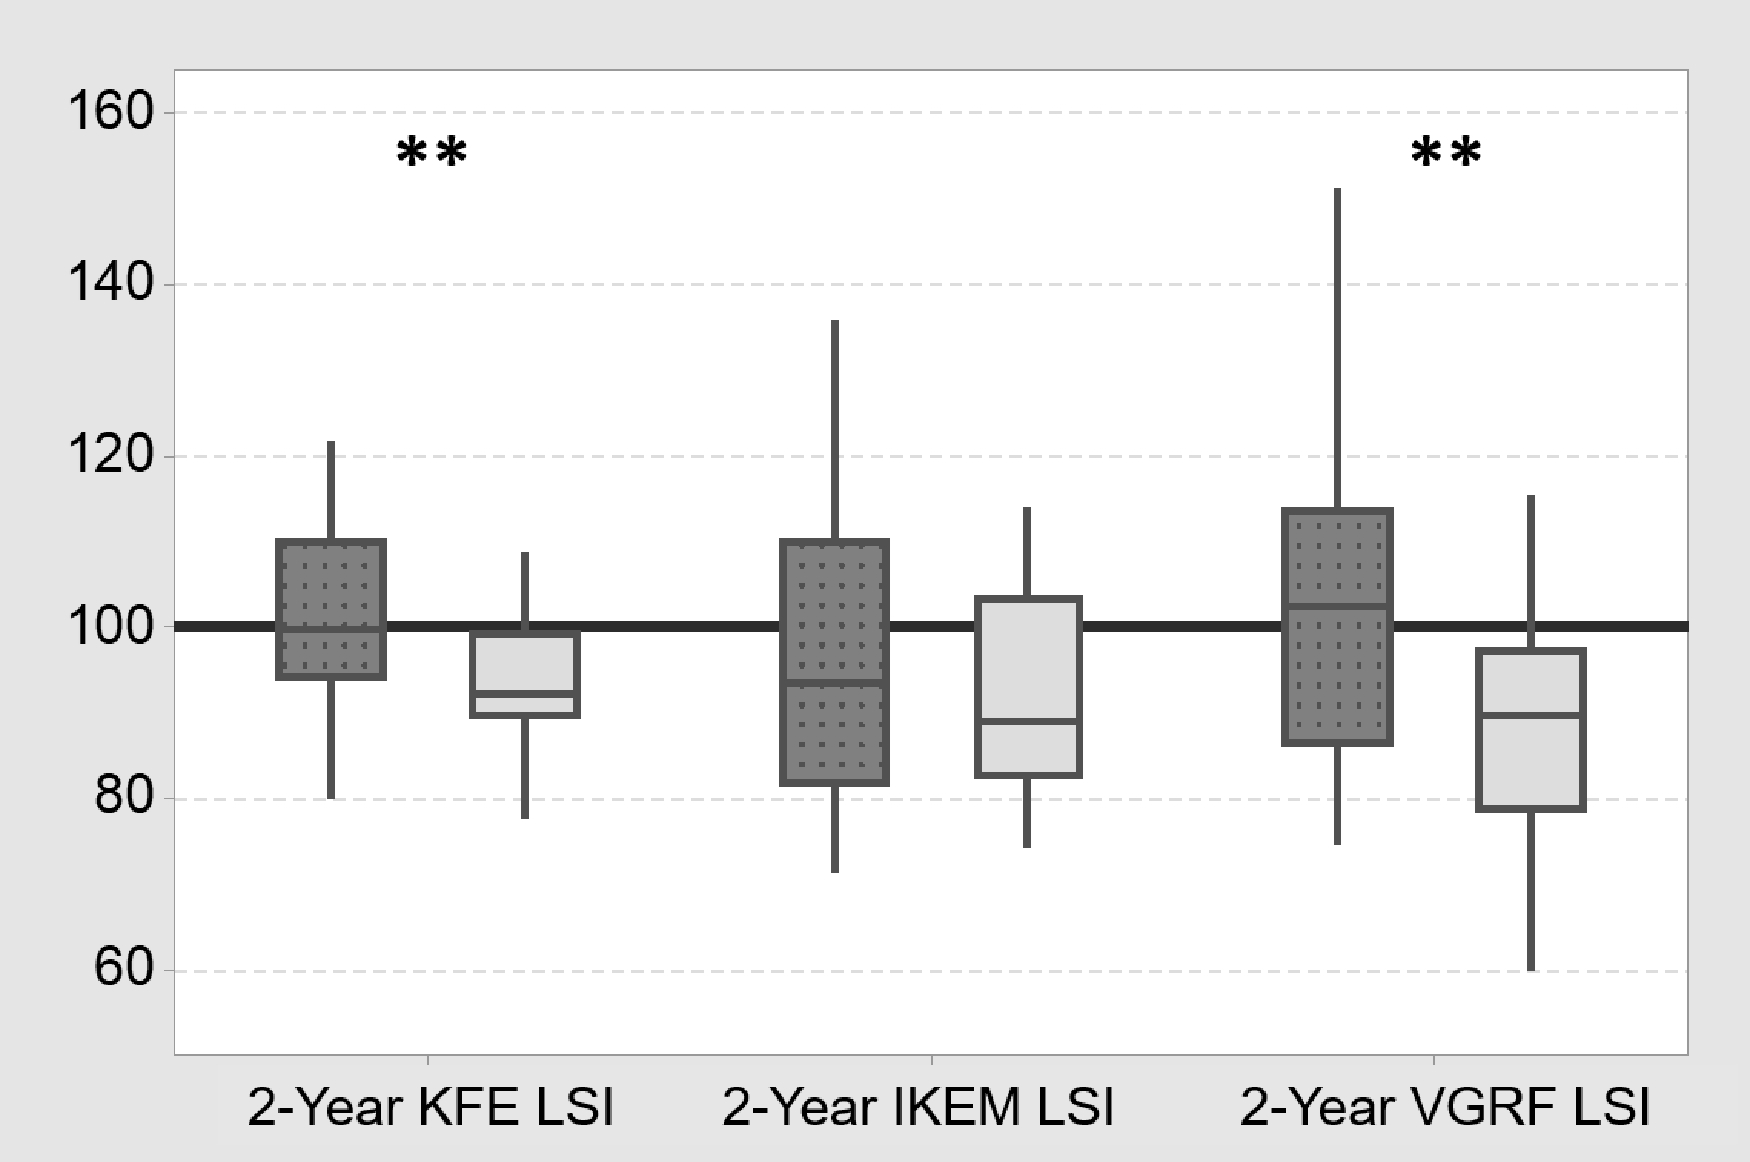
Dark gray dotted box plots are data from the RTS HQ group. Light gray box plots are data from the RTS LQ group. The red line indicates perfect symmetry (LSI=100%). ** indicates p<0.05 for Mann Whitney U group comparisons. The values demonstrated within the box plots are median (middle line), interquartile range (top and bottom of the box), and the highest and lowest observations (whiskers). RTS, return-to-sport; KFE, knee flexion excursion; LSI, limb symmetry index; IKEM, internal knee extension moment; VGRF, vertical ground reaction force