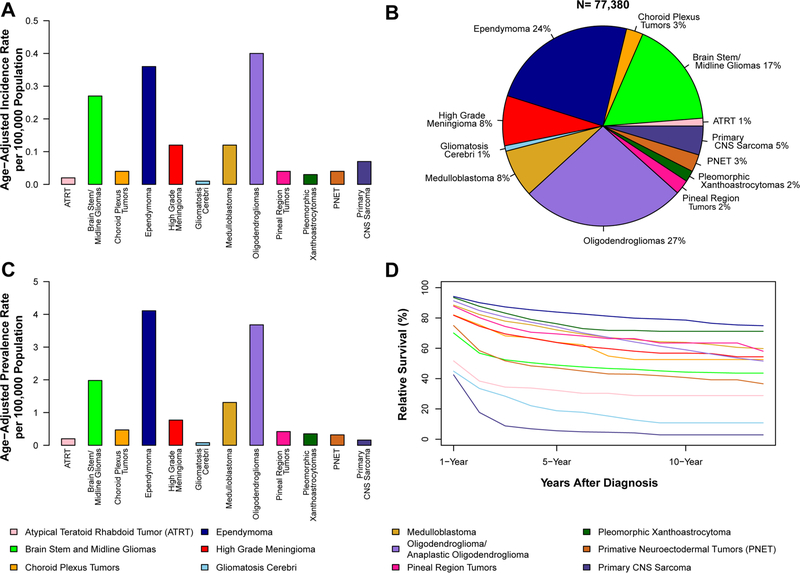
Fig. 1.
a Annual average age-adjusted incidence rates, brain and other central nervous system (CNS) tumors by selected histology, CBTRUS, 2000–2014; b Tumor distribution, brain and other CNS tumors by selected histology, CBTRUS, 2000–2014; c age-adjusted point prevalence rates, brain and other CNS tumors by selected histology, CBTRUS and SEER, 2014; d 1-, 5-, and 10-year relative survival rates for brain and other CNS tumors by selected histology, SEER 18 Registries, 2000–2014

