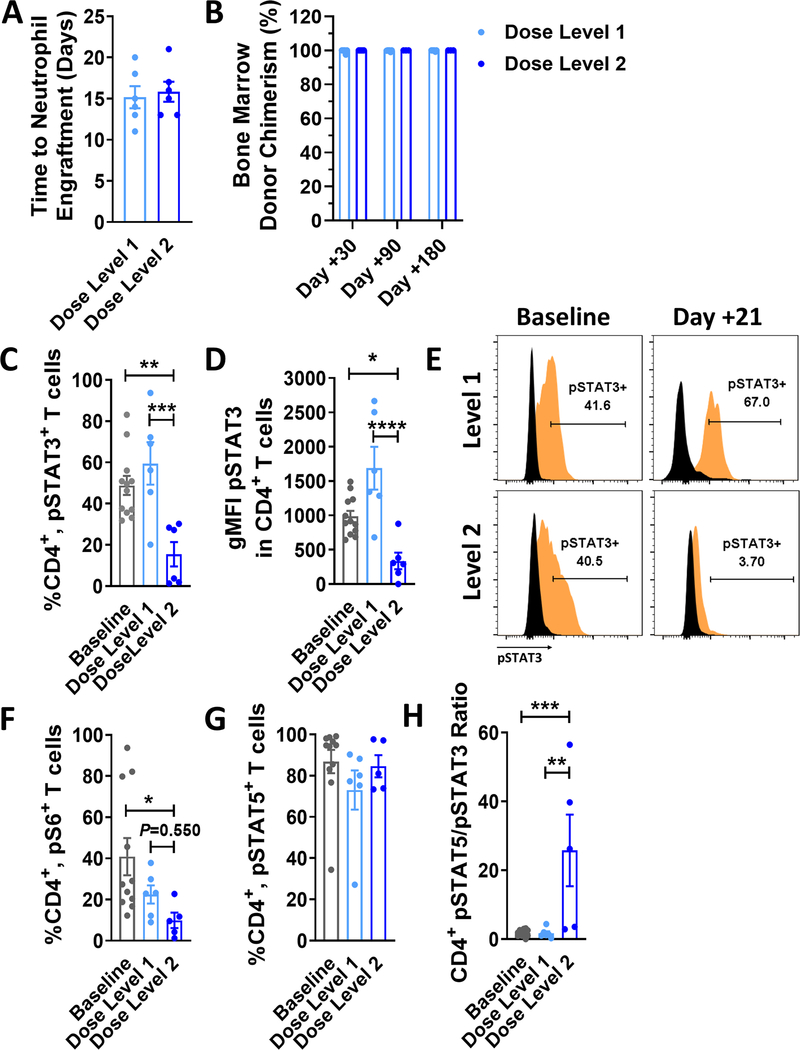
Figure 5. Engraftment, pharmacodynamics, and pharmacokinetics of PAC/SIR/TAC.
A) Graph shows the time of engraftment in days post allo-HCT (mean ± SEM) among patients treated on dose level 1 or dose level 2 of the phase I trial. B) Donor chimerism (mean ± SEM) within the recipient bone marrow is shown at 1, 3, and 6 months post allo-HCT. The C) frequency and D) geometric MFI (mean ± SEM) of CD4+, pSTAT3+ T cells at day +21 are shown. E) Representative histograms are shown for pSTAT3 gating on CD4+ T cells at baseline/pretransplant and day +21 (isotype = black, pSTAT3 = orange). A goal of the phase I trial was to identify a safe dose of pacritinib that achieved <35% CD4+, pSTAT3+ T cells at day +21. Graphs depict the frequency (mean ± SEM) of F) CD4+, pS6+ (downstream of mTOR) and G) CD4+, pSTAT5+ T cells. H) Graph shows the ratio (mean ± SEM) of pSTAT5+/pSTAT3+ CD4+ T cells in circulation at day +21 post allo-HCT. ANOVA (C, D, F, H). *P<.05, **P=.001–.01, ***P=.0001–.001, and ****P<.0001. Baseline data were acquired pretransplant between days −30 and −5.

