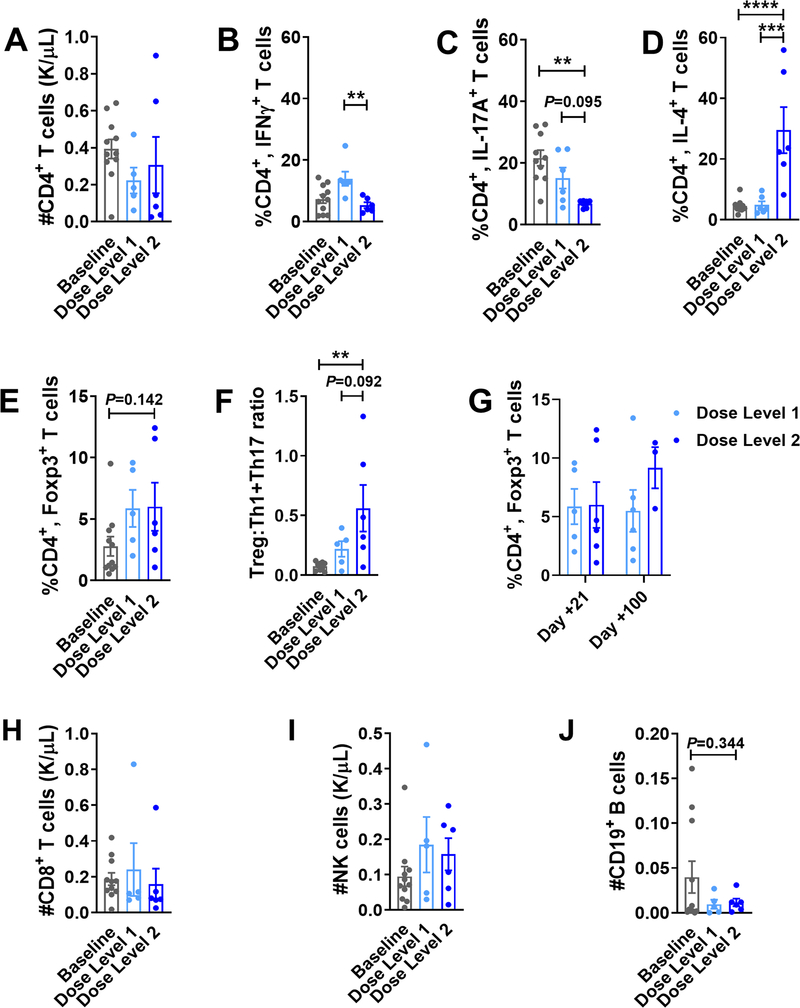
Figure 6. PAC/SIR/TAC favors Tregs over pathogenic Th1 and Th17 cells.
Bar graphs show the A) total number (mean ± SEM) of CD4+ T cells at day +21 and frequency (mean ± SEM) of B) CD4+, IFNγ+ Th1, C) CD4+, IL-17+ Th17, D) CD4+, IL-4+ Th2, and E) CD4+, CD127neg, CD25+, Foxp3+ Treg cells at day +21 among patients treated on dose level 1 or dose level 2 of the phase I trial. F) Graph depicts the ratio (mean ± SEM) of Treg to Th1 and Th17s at day +21. G) Graph shows Treg reconstitution at day +21 versus day +100 after allo-HCT. Bar graphs show the absolute numbers (mean ± SEM) of (H) CD8+ T cells, (I) NK cells, and (J) B cells at day +21 among patients treated on dose level 1 or dose level 2 of the phase I trial. ANOVA (B-F, J). **P=.001–.01, ***P=.0001–.001, and ****P<.0001. Baseline data were acquired pretransplant between days −30 and −5.

