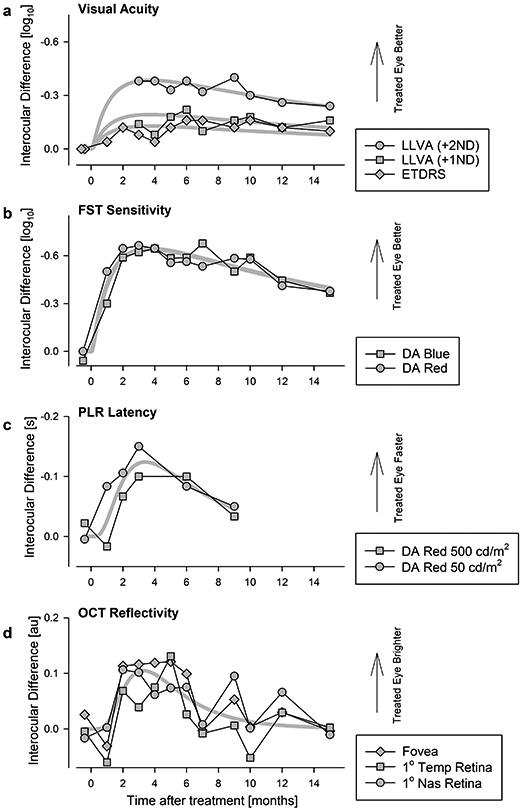
Figure 1: Time Course of Vision Improvement and Durability Over Fifteen Months After a Single Treatment.

a, b, Interocular difference in visual acuity (a) and FST light sensitivity (b). Peak improvement occurs near month 3 followed by a slow decline over 12 months. At 15 months, all measures remain better than baseline. Visual acuities measured under standard (ETDRS) and two low-luminance (LLVA) conditions. Symbols in panel a are individual data points. Symbols in panel b are differences of means from 6-20 replicates. c, Pupil constriction latency as an objective measure of visual function demonstrates an interocular difference that peaks at 3 months and declines thereafter. Symbols are differences of means from 1-3 replicates. d, Magnitude of OCT reflectivity near the photoreceptor ciliary transition zone showing a transient peak at 3-5 months followed by decline to baseline by 15 months. Symbols are differences of means from 3 replicates. Thick gray lines represent the 3-parameter log-normal fits to data in individual sets (a) or in combination (b-d).
