
Extended Data Fig. 8. Quantification of the photoreceptor sublaminae for 15 months following treatment.
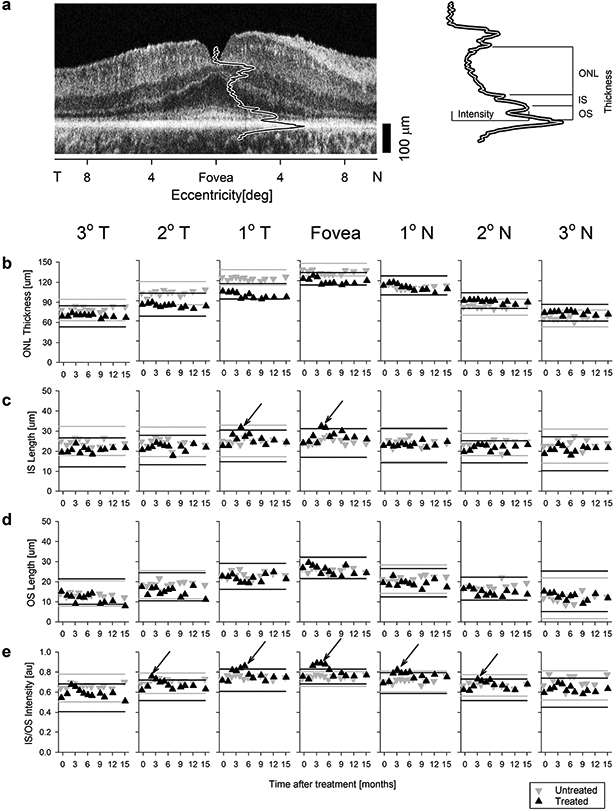
a, Representative OCT scan showing the foveal longitudinal reflectivity profile (LRP) and the three thickness parameters (ONL thickness, IS length, and OS length) and one intensity parameter (IS/OS intensity) quantified. b-e, Photoreceptor sublaminae parameters consisting of outer nuclear layer (ONL) thickness (b), inner segment (IS) length (c), outer segment (OS) length (d), and IS/OS intensity (e) are shown. Seven panels on each row represent data from 7 retinal locations as a function of time after treatment. Gray and black lines delimit test-retest variability in the untreated and treated eye, respectively. Black arrows point to transient changes in IS length and IS/OS intensity between months 2 and 5 in the treated eye (black up triangle). T, temporal retina; N, nasal retina. Each symbol in panels b-e represents the average of three replicates. Interocular differences of the IS/OS intensity at fovea and 1° T and N eccentricities shown in panel e are plotted in Fig.1d.