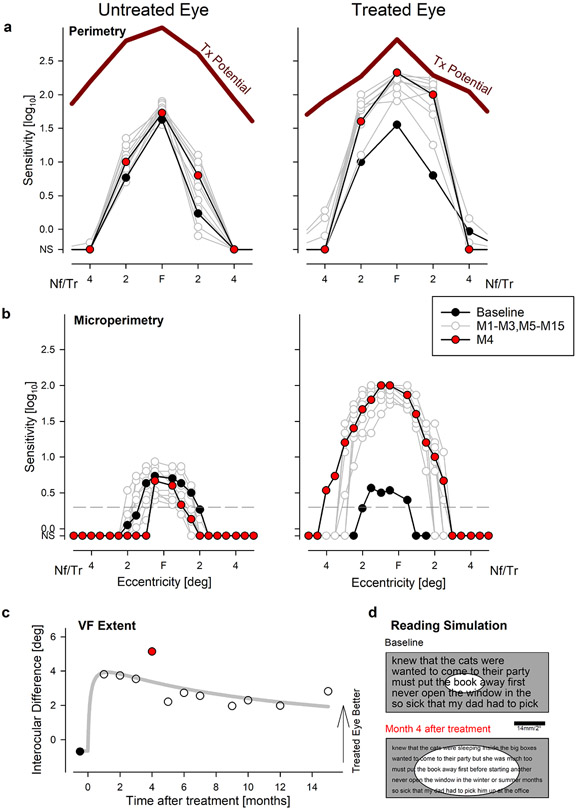
Figure 2: Improvement of Foveal Sensitivity, Expansion of Visual Field and Predicted Effect on Reading Performance.
a, b, Visual field sensitivities across the central 8° diameter region with free-viewing perimetry (a) and gaze controlled microperimetry (b) at baseline (black), at 4 months (red), and other times (gray) during 15 months of followup. Maximum treatment (Tx) potential predicted from artificial intelligence is shown as thick red lines. In the untreated eye, there are no changes. In the treated eye, there are major improvements within the central 4° starting at month 1 reaching a peak at month 4 and remaining well above baseline by month 15. Gray horizontal dashed line (b) is the sensitivity criterion at which visual field extent was estimated. Nf, Tr refer to nasal visual field and temporal retina, respectively. NS, not seen. All symbols represent individual data points. c, Interocular difference of visual field extent demonstrating the peak effect and durability. d, Simulation of readability of text at baseline and month 4 in the treated eye taking into account visual acuity improvement (smaller font) and the expansion of the visual field (elliptical windows). Calibration bar would subtend 2° when text is appropriately enlarged and held at the standard 40 cm reading distance.

