
Extended Data Fig. 2. Evaluation of visual acuity.
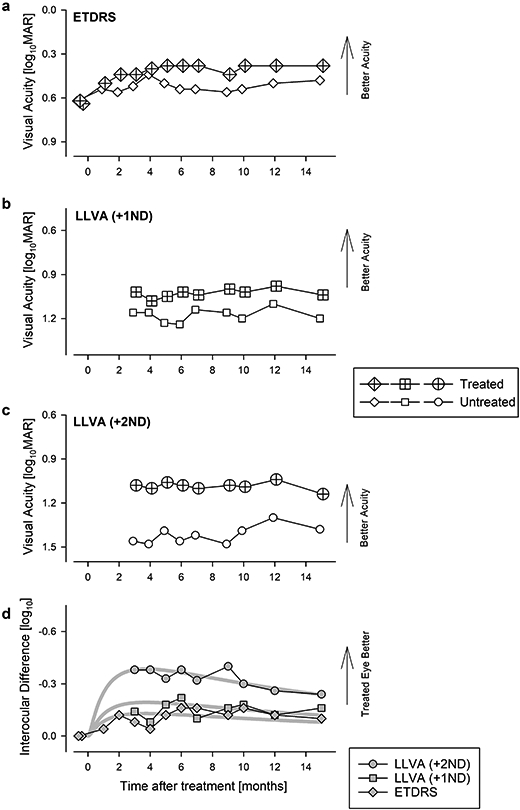
a, Change in best corrected ETDRS acuity from baseline where both eyes were symmetric. After treatment, there was a larger improvement in the treated eye compared to untreated eye. Acuity in the treated eye remained asymmetric and better than baseline at 15 months. b, c, Specialized assessments of low-luminance visual acuity (LLVA) starting at 3 months after treatment using neutral density filters, +1ND (b) and +2ND (c). Symbols in panels a,b, and c are individual data points. d, Interocular difference of different acuity measures. Thick gray lines represents the 3-parameter log Normal fit to data. Symbols in panel d are differences between individual data points from each eye. Panel d is duplicated in Fig.1a.