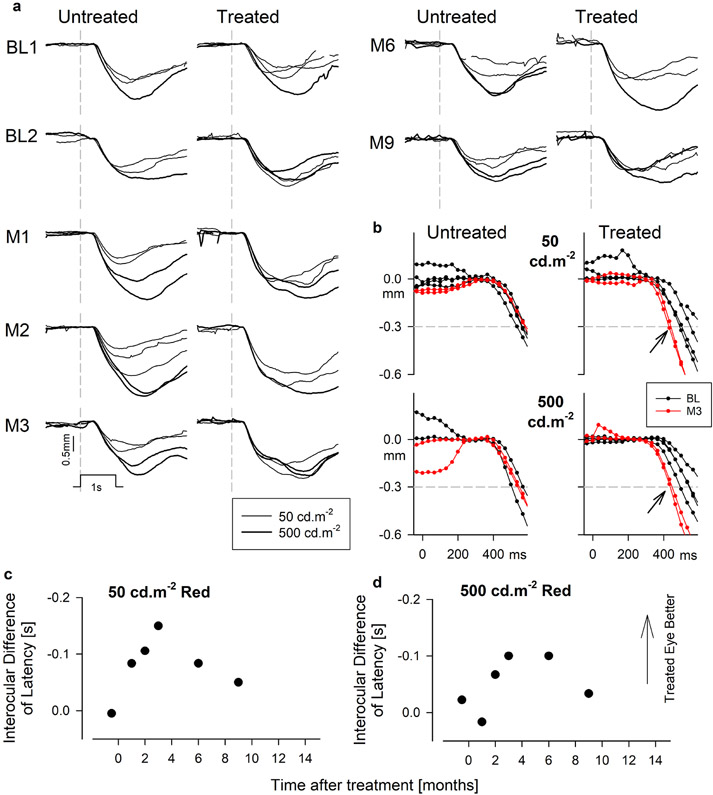
Extended Data Fig. 5. Changes in objective measures of visual function with dark adapted pupillometry.
a, Raw traces of pupillary diameter as a function of time for brief (1s) red flashes of 50 (thinner traces) and 500 (thicker traces) phot-cd.m−2 luminance at different visits. Vertical gray dashed lines represent the onset of the flash. Stimulus marker and scale bar are shown. b, Magnified view showing the early phases of constriction in the untreated and treated eyes at baseline (black) and month 3 (red) for the two stimuli. Horizontal dashed lines mark the criteria of 0.3 mm constriction used to define latency. Arrows demonstrate the acceleration of the response. c,d, Interocular differences of latency as a function of time after treatment for both red stimuli. Results show pupil constrictions accelerating to a peak at month 3 in the treated eye. Symbols are the differences of means from 1-3 replicates. Panels are duplicated in Fig.1c.

