
Figure 3 .
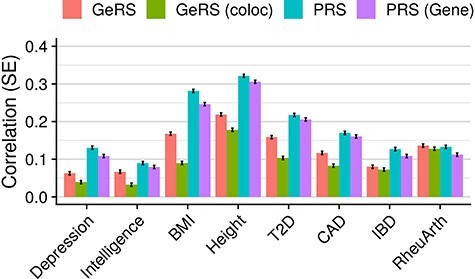
Shows the correlation between predicted and observed values in UKB for models. GeRS = All SNP-weight set GeRS; GeRS (coloc) = All SNP-weight set GeRS restricted to genes with a colocalization PP4 > 0.8; PRS = Genome-wide PRS; PRS (Gene) = PRS restricted to gene regions considered by GeRS.