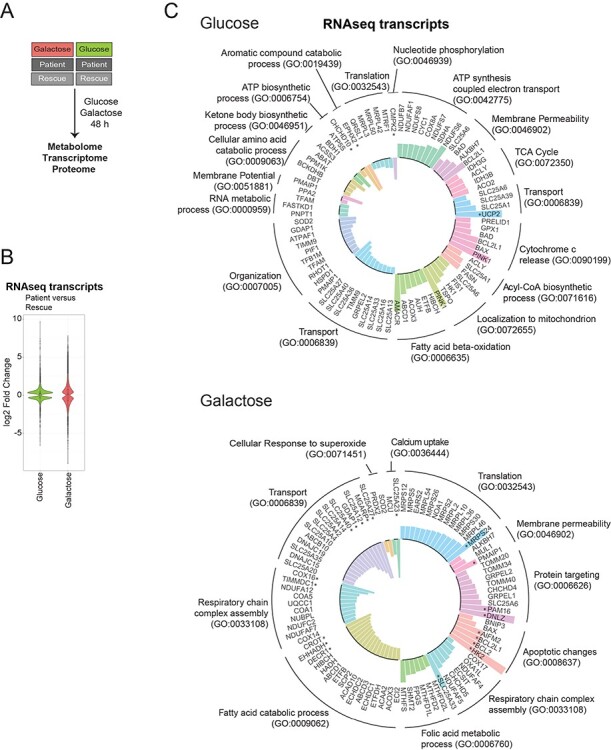
Figure 1 .

Altered biological processes revealed by RNAseq analysis. (A) Schematic representation of the omics experiments. Patient and rescue cells were grown in glucose or galactose media for 48 h and subsequently, the metabolome, transcriptome and proteome were analysed. ‘Glucose’ (green) represents the comparison of patient versus rescue cells in glucose. ‘Galactose’ (red) represents the comparison of patient versus rescue cells in galactose. (B) Violin plot representing the distribution of log2 fold change of expression for transcripts (patient vs rescue) in the two conditions (‘Glucose’, green and ‘Galactose’, red) with an adjusted P-value < 0.05 (FDR < 0.05). The effect size was larger for the ‘Galactose’ condition. (C) Circular bar plot depicting mitochondrial transcripts with a minimum log2 fold change (patient vs rescue) of ±0.3 in ‘glucose’ and ‘galactose’, grouped based on the GO term: biological processes. Bars facing upwards from the inner circle represent the upregulated transcripts, and bars facing inwards represent the downregulated transcripts. Asterisk ‘*’ indicates transcripts with a log2 fold change >1.
