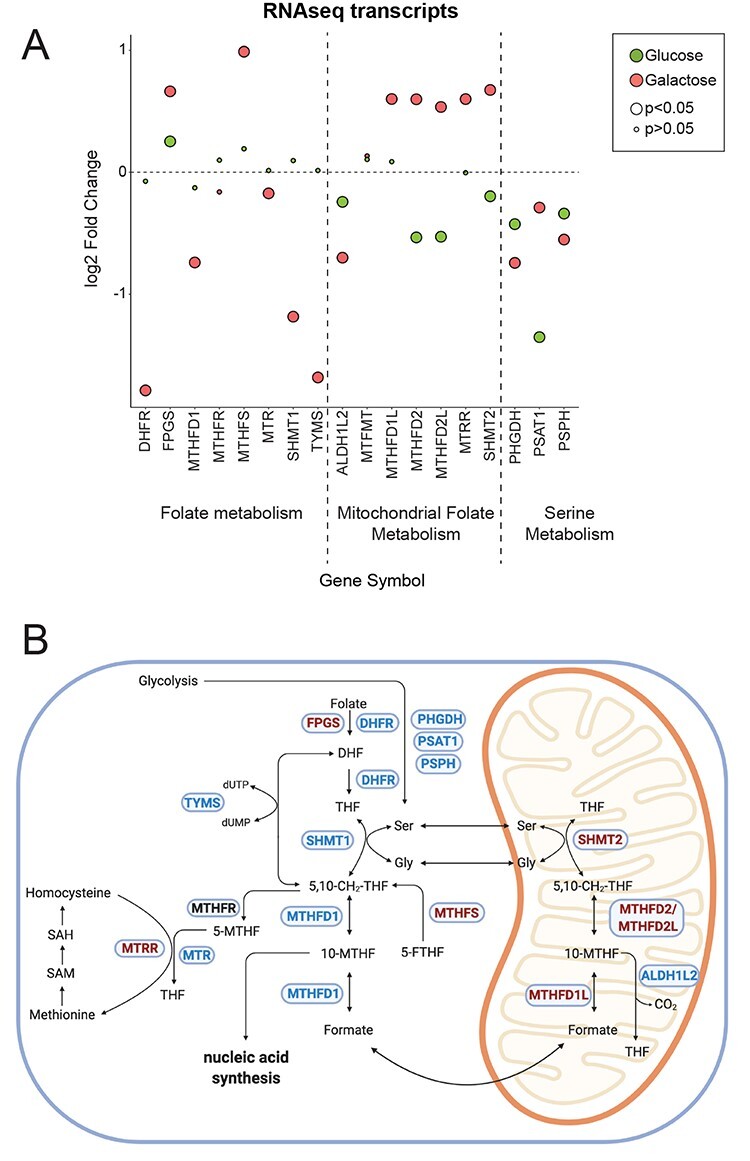
Figure 2 .

RNAseq analysis reveals changes in one-carbon metabolism. (A) Dot plot representing the fold change of the transcripts of the folate and serine metabolism. Fold change is represented in log2 scale. Large circles represent significant values (FDR < 0.05), small circles show non-significant values (FDR > 0.05). ‘Glucose’ (green) represents the comparison of patient versus rescue cells in glucose. ‘Galactose’ (red) represents the comparison of patient versus rescue cells in galactose. (B) Graphical representation of enzymes and metabolites of the one-carbon metabolism. Selected enzymes are shown in blue boxes for cytosolic and mitochondrial folate metabolism as well as serine and methionine metabolism. Upregulated transcripts in patient cells in galactose are shown in red and downregulated transcripts in blue. This scheme was created with BioRender.
