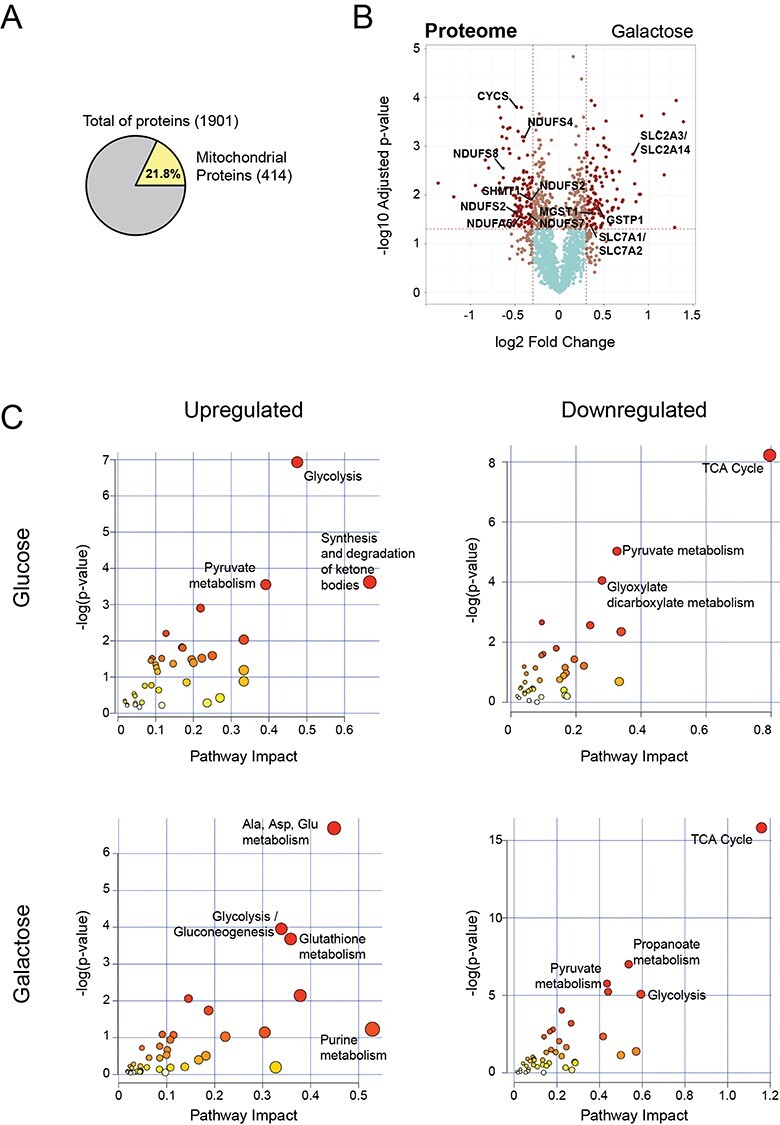
Figure 4 .

Integration of proteomics and metabolomics confirms stalled TCA cycle at the protein level. (A) Pie chart representing the total number of proteins identified in all conditions by TMT quantitative proteomics analysis. Number of nuclear encoded mitochondrial proteins (MitoCarta2.0) are indicated in yellow, as well as the percentage relative to the total. (B) Volcano plot representing the results of differential protein expression analysis between patient and rescue cells in galactose. x-axis values represent the log2 fold change and y-axis values represent the -log10 of the adjusted P-value. Selected mitochondrial proteins are labelled. (C) Joint pathway enrichment analysis performed with the MetaboAnalyst tool of significant up- or downregulated metabolites and proteins in glucose and galactose condition. Scatterplots represent P-values from integrated enrichment analysis and impact values from pathway topology analysis using KEGG metabolic pathways. The node colour represents the P-values and the node radius is based on the pathway impact values calculated with degree centrality.
