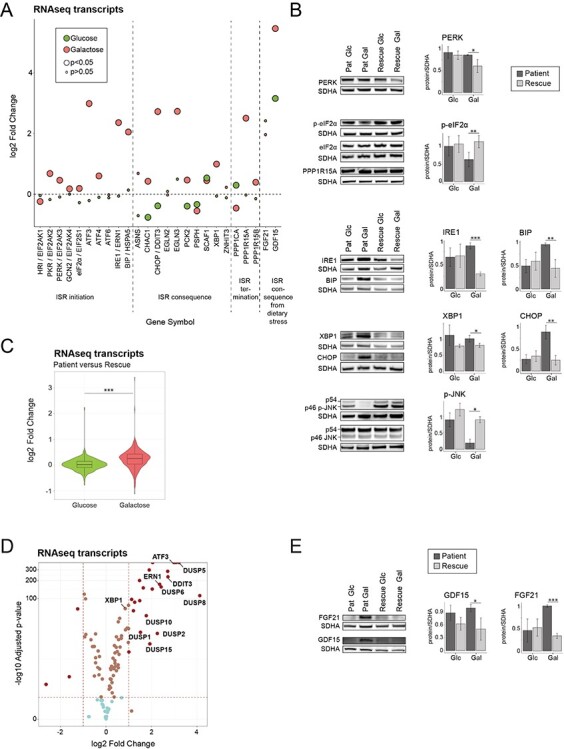
Figure 5 .

Metabolic dysfunction leads to a canonical ER stress response in patient cells in galactose. (A) Dot plot representing the fold change of the transcripts of ISR in the ER. Fold change is represented in log2 scale. Large circles represent significant values (FDR < 0.05), small circles show non-significant values (FDR > 0.05). ‘Glucose’ (green) represents the comparison of patient versus rescue cells in glucose. ‘Galactose’ (red) represents the comparison of patient versus rescue cells in galactose. (B) Immunoblot analysis of the proteins involved in the integrated stress response of the ER. Whole cell extracts from patient and rescue fibroblasts grown in glucose or galactose for 2 days were separated by SDS-PAGE and probed with antibodies against indicated proteins. SDHA was used as a loading control. Bar plot indicates the quantification of four (PERK), 7 (P-eIF2alpha), and three (IRE1, BIP, XBP1, CHOP, p-JNK) immunoblot analyses, normalized to SDHA, where patient is depicted in dark grey and rescue in light grey, *P < 0.05, **P < 0.01, ***P < 0.001. (C) Violin plot representing the distribution of the log2 fold change (patient/rescue) for transcripts involved in translation for the glucose and galactose condition. Box plots indicate the median and the first and third quartile. Wilcoxon statistical test, ***P < 0.001. (D) Volcano plot representing the results of differential gene expression analysis between patient and rescue cells in galactose for proteins involved in the ISR in the ER. x-axis values represent the log2 fold change and y-axis values represent the -log10 of the adjusted P-value. Selected genes of interest are labelled. (E) Immunoblot analysis of GDF15 and FGF21. Whole cell extracts from patient and rescue fibroblasts grown in glucose or galactose for 2 days were separated by SDS-PAGE and probed with antibodies against GDF15 and FGF21. SDHA was used as a loading control. Bar plot indicates the quantification of 4 (FGF21) and 3 (GDF15) immunoblot analyses, normalized to SDHA, where patient is depicted in dark grey and rescue in light grey, *P < 0.05, **P < 0.01, ***P < 0.001.
