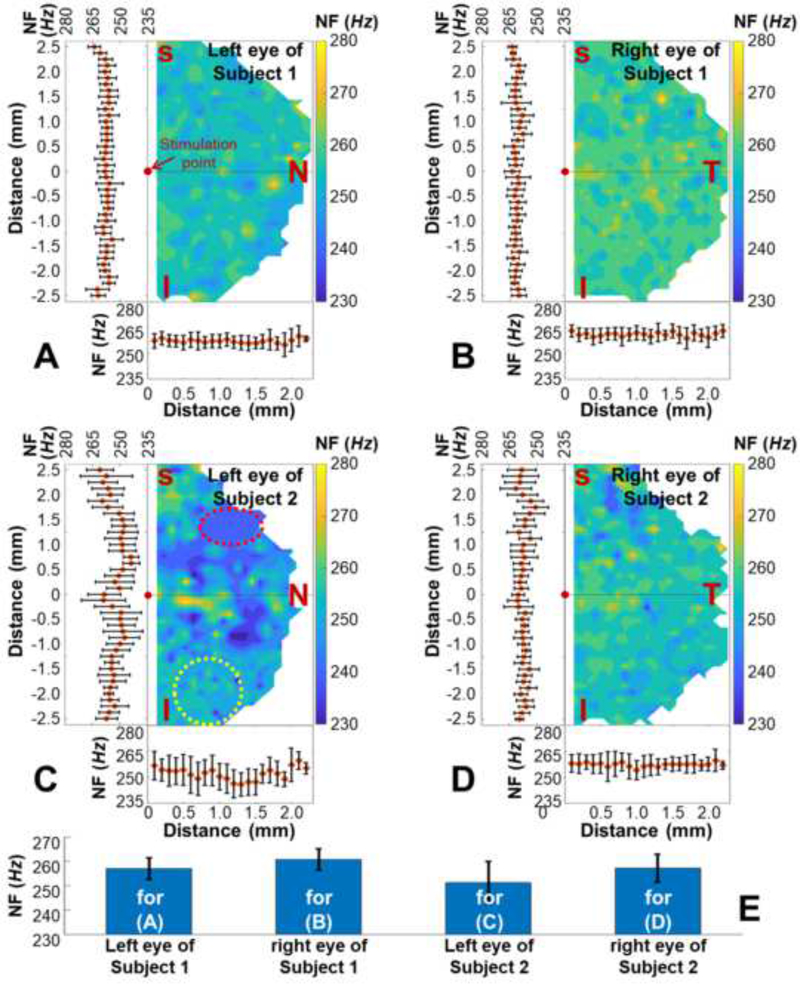
Fig. 3.
Natural frequency (NF) characterization for ~ 2.5×5 mm2 area (26 × 41 points; total time: 106.6 s) on the left and right corneas from two human subjects (stimulation: 13 Pa, 10 Hz). Panels (A)–(D) show the 2-D plots of the NF distributions and the corresponding means and SDs in the horizontal and the vertical directions. (E) Bar plots (means ± SDs) for the NF values corresponding to Panel(A) – Panel(D).

