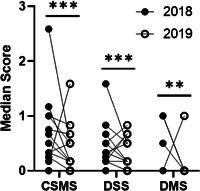
Figure 6.

Allergy symptoms during birch pollen season. Comparison of the median daily CSMS, DSS, and DMS during the peak pollen period before and after therapy (n = 16) in 2018 and 2019; ***p < .001, **p ≤ .01, Wilcoxon signed‐rank test. CSMS, combined symptom and medication score; DMS, daily medication score; DSS, daily symptom score
