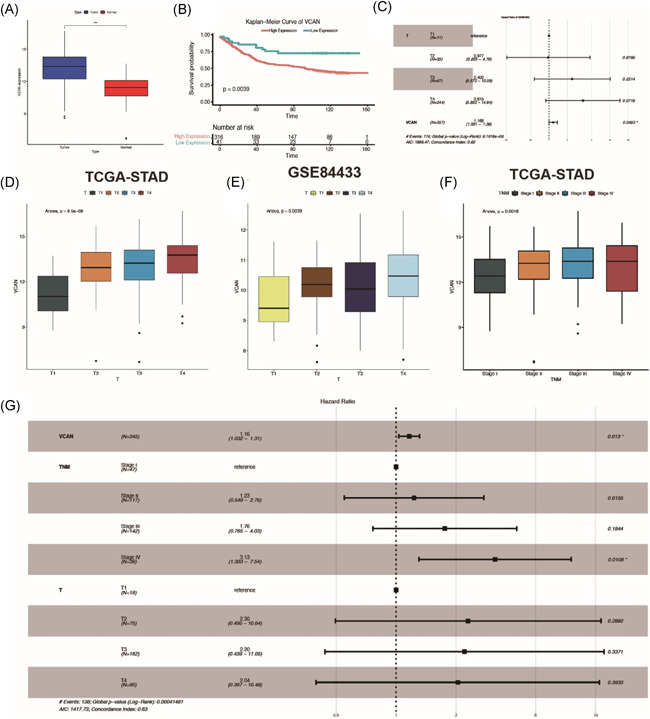
Figure 3.

VCAN act as a tumor promoter in gastric cancer. (A) The expression of VCAN in gastric cancer and adjacent tissues. (B) Kaplan–Meier analysis showed that the higher the expression level of VCAN, the worse the prognosis of gastric cancer patients. (C) COX analysis showed that T stage and VCAN were both poor prognostic factors. (D, E) The box diagram showed the relationship between VCAN expression and T staging in TCGA and GEO database, respectively. (F) The box diagram showed the relationship between VCAN expression and TNM stage. (G) COX analysis showed that VCAN and T staging were associated with poor prognosis. GEO, Gene Expression Omnibus; TCGA, The Cancer Genome Atlas
