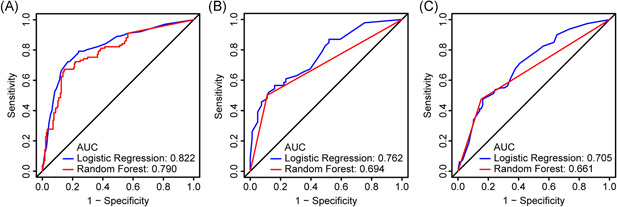
Figure 3.

ROC analysis to assess the performance of LG and RF in predicting the severe type COVID‐19 in the three cohorts. (A) Training cohort, (B) internal validation cohort, and (C) external validation cohort. AUC, area under the curve; COVID‐19, coronavirus disease 2019; LG, logistic regression; RF, random forest; ROC, receiver operating characteristic
