
Figure 5.
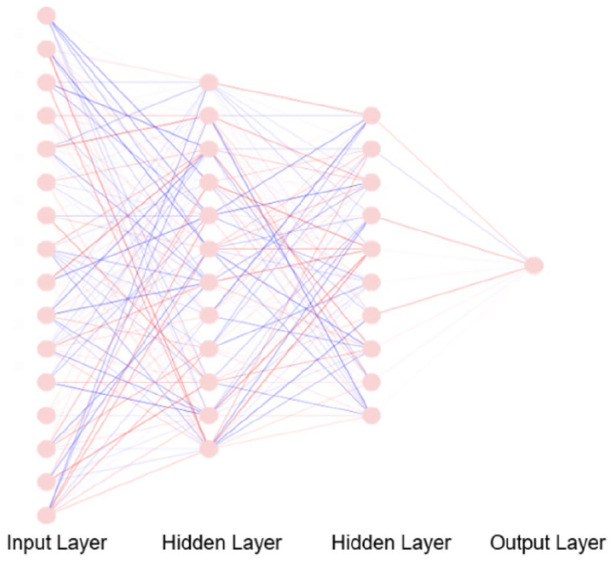
A representation of the ANN with a 16-dimensional input layer and two hidden layers; each one with 12 and 10 neurons. Each of the two hidden layers may represent a specific type of features that need to be detected. The interaction between two nodes is represented by coloured edges, where positive interaction is shown by red and negative interaction is shown by blue. The edge width and edge opacity are proportional to edge weights.