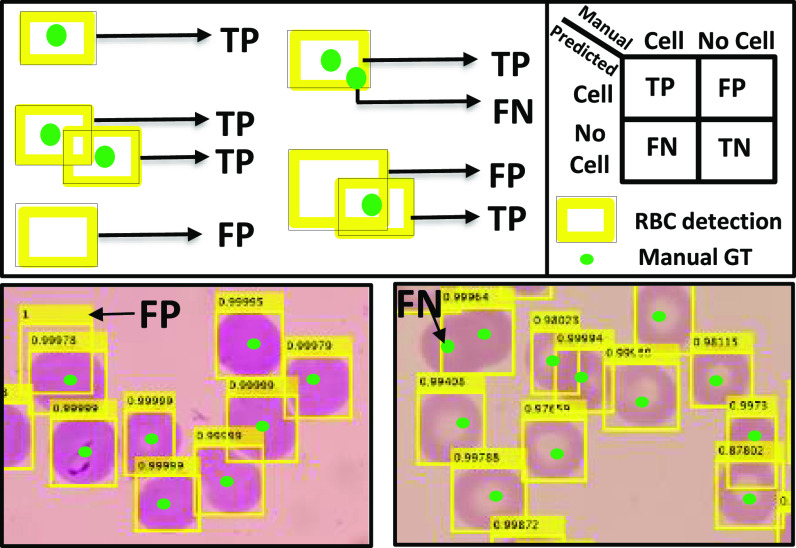
Fig. 5.
Evaluating detection accuracy for counting RBCs using one-to-one matching assessment with the confusion matrix shown in the upper right. Upper left figure shows examples of TP, FP, and FN. For point correspondences we do not use specificity or TN rate as most of the image pixels are TN. In the bottom row the yellow bounding boxes are RBCNet algorithm detections and the green points are the expert's manual ground-truth point annotations.

