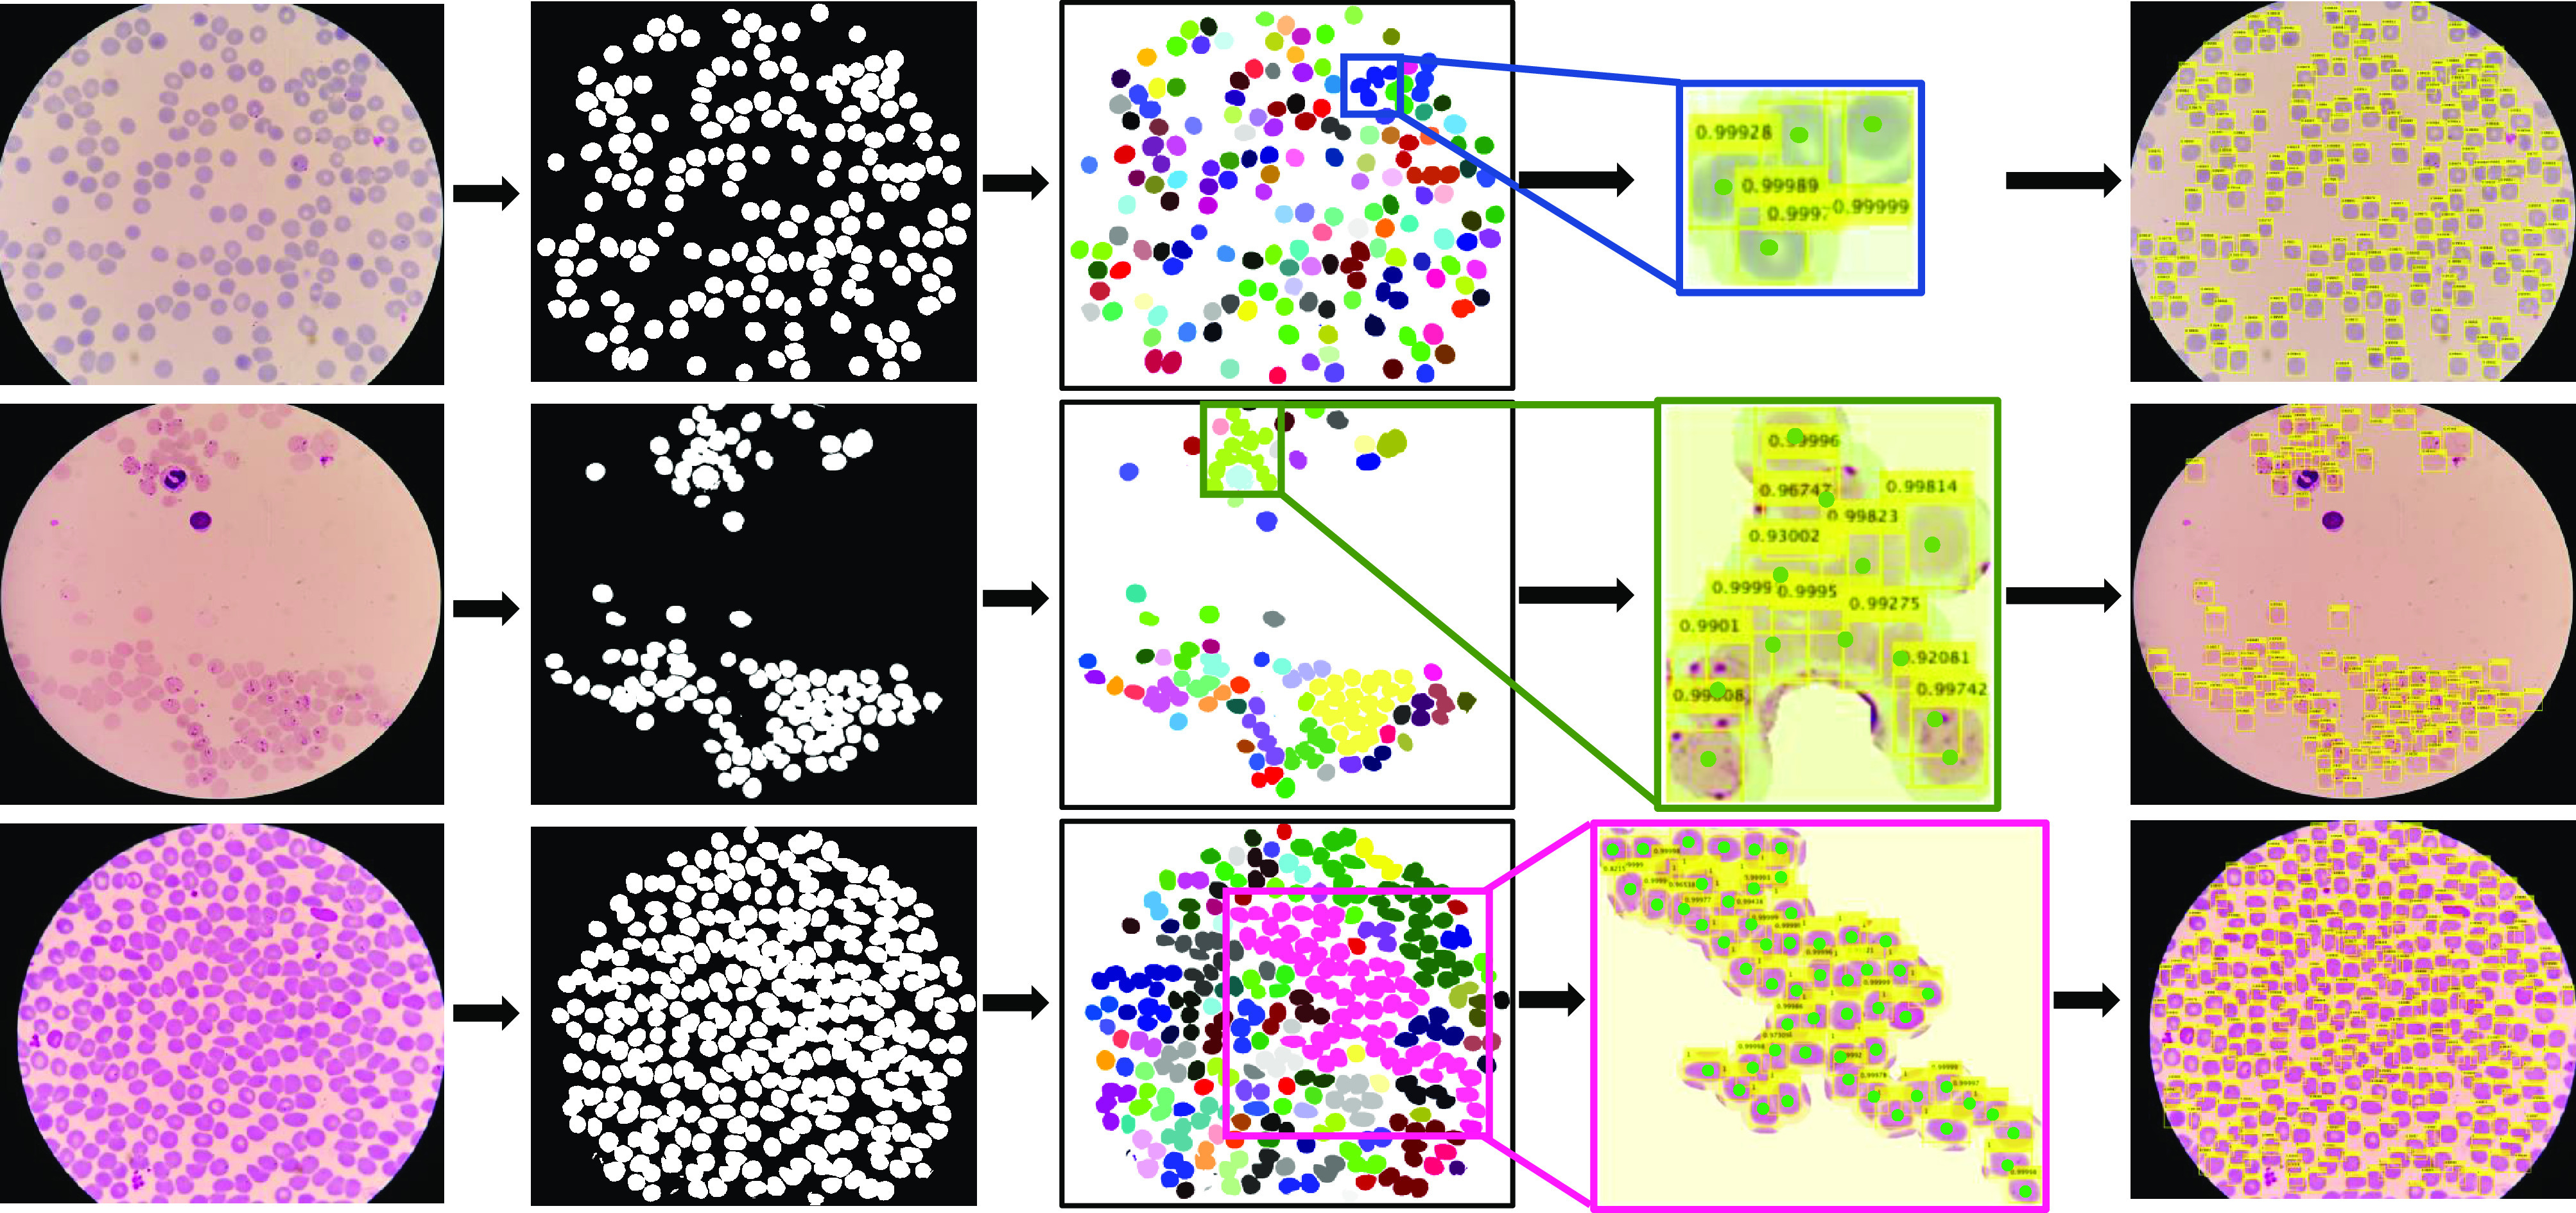
Fig. 6.

Three examples of cell clumps of different sizes for which our dual deep network architecture pipeline RBCNet successfully identifies individual cells. The examples show the connected components generated from the U-Net foreground mask and the bounding boxes of individual cells detected by our Faster R-CNN model. The first column shows the field of view for the raw image, the second column shows the binary mask produced by U-Net, and the third column shows the connected component labeling for U-Net's binary mask. In the fourth column are zoomed-in examples of connected components for which Faster R-CNN detects all cells. Green dots represent the gold standard ground- truth (GT) annotation. The last column visualizes all bounding boxes for all cell clumps superimposed on the raw image. Combination of U-Net training using tiles along with connected component labeling for the output mask enables cells and cell clusters (i.e. touching or overlapping cells) to be accurately detected and segmented across tile boundaries. The cell clusters identified by U-Net typically have smooth borders and very little fragmentation.
