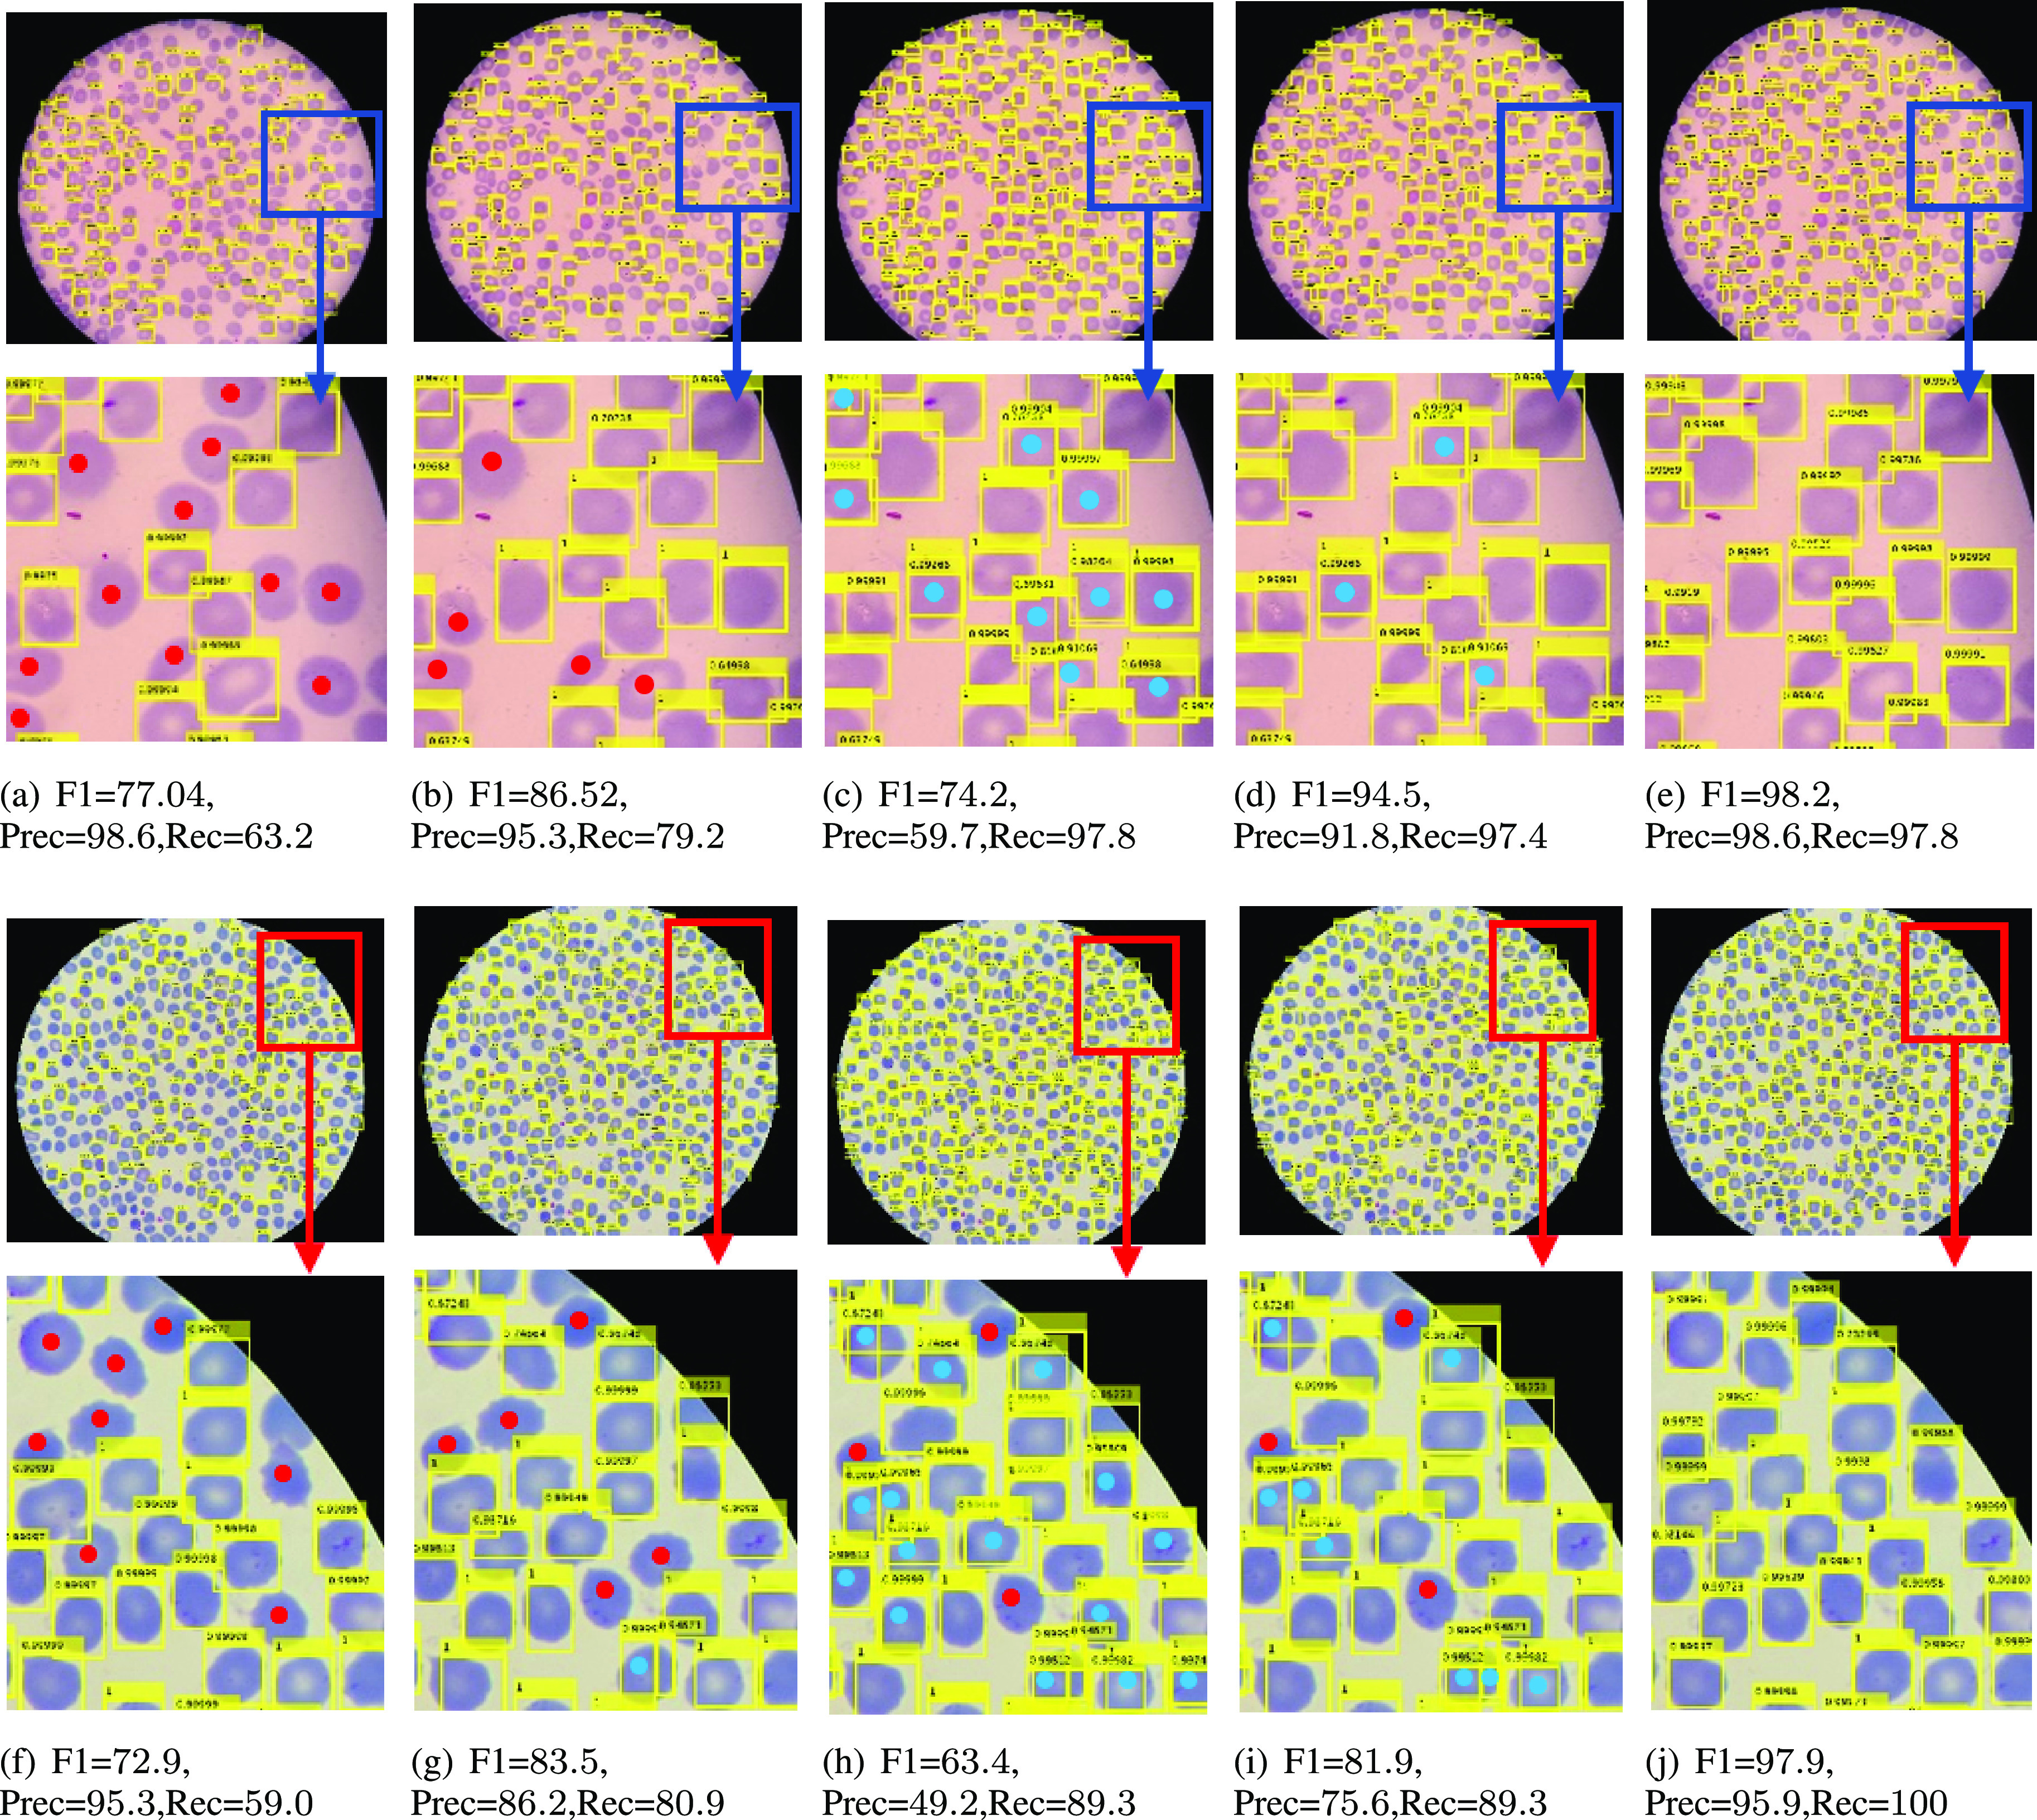
Fig. 9.

Output of Faster R-CNN for different input configurations: First column (a, f) shows Faster R-CNN applied to the full image, second column (b, g) shows Faster R-CNN results for non-overlapping tiles, third column (c, h) are Faster R-CNN results on overlapping tiles, fourth column (d, i) contains results with overlapping tiles and non-maximum suppression, and last column (e, j) shows results for our proposed method. Red dots  represent false negatives and blue dots
  represent false positives. Our results in the last column provide a better F1 measure in all cases compared to other inference schemes.
