
Fig. 2.
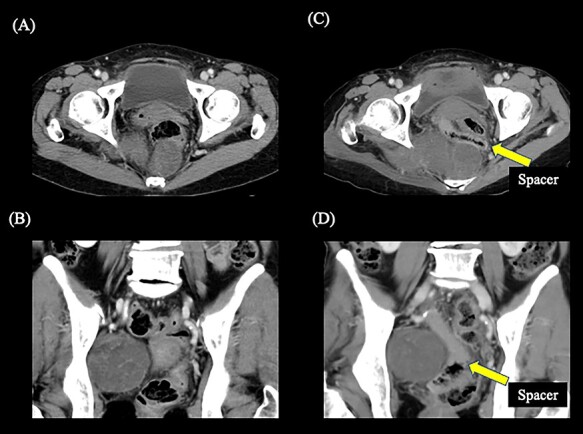
Contrast-enhanced computed tomography showing the positional relationship between the tumor and the rectum. (A) Axial image before spacer placement. (B) Coronal image before spacer placement. (C) Axial image after spacer placement. (D) Coronal image after spacer placement. The yellow arrow shows the spacer. The gas is formed within the spacer due to the process of hydrolysis after placement of the spacer.