
Fig. 2.
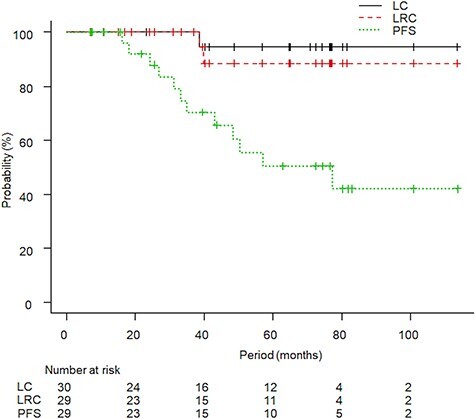
The Kaplan–Meier curves for local control (LC), locoregional control (LRC) and progression-free survival (PFS) are shown. The five-year LC, LRC and PFS rates were 94%, 88% and 50%, respectively.
Official websites use .gov
A
.gov website belongs to an official
government organization in the United States.
Secure .gov websites use HTTPS
A lock (
) or https:// means you've safely
connected to the .gov website. Share sensitive
information only on official, secure websites.
The Kaplan–Meier curves for local control (LC), locoregional control (LRC) and progression-free survival (PFS) are shown. The five-year LC, LRC and PFS rates were 94%, 88% and 50%, respectively.