
Fig. 3.
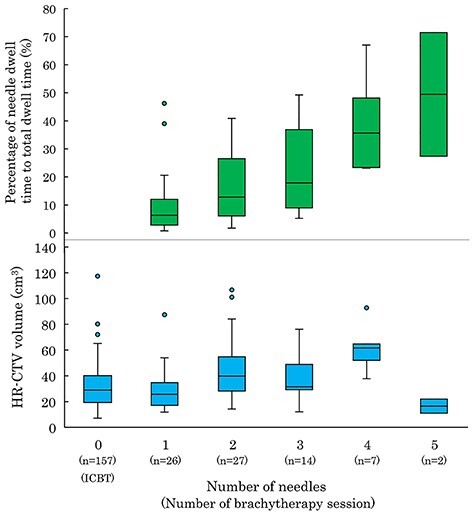
A box plot showing the relationship between HR-CTV, needle contribution and number of needles. The 50% interquartile range, median and range of data are displayed.
Official websites use .gov
A
.gov website belongs to an official
government organization in the United States.
Secure .gov websites use HTTPS
A lock (
) or https:// means you've safely
connected to the .gov website. Share sensitive
information only on official, secure websites.
A box plot showing the relationship between HR-CTV, needle contribution and number of needles. The 50% interquartile range, median and range of data are displayed.