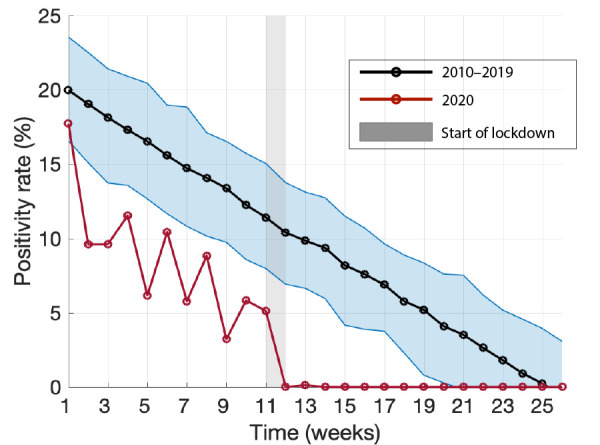
Figure 2.

Bayesian inference for the mean positivity rate and its 95% credible interval of influenza A and B for the first 26 weeks in 2010–2019
Note: The red curve shows the positivity rate of influenza A and B for 2020, with the shaded grey bar indicating the start of COVID-19 lockdown
